
Most of what you credit to Paid Brand Search isn’t actually caused by it.
Across dozens of holdout tests and hundreds of MMM outputs, we consistently see the same pattern:
Paid Brand Search conversions are 10% incremental.
(Technically 9.7% incremental, but let’s round up to make this article easier to read.)
That’s a key finding from a number of models and tests we have run on paid brand search activity.
If you turn all the paid brand search ads off, then 90% of the purchases attributed to the paid search campaigns would still buy from your organic search listings.
It isn’t saying those campaigns do nothing, 10% of the attributed sales don’t buy from you on organic search. Those people made a search for your brand name, but because you no longer defended the top paid search position they saw something else from a competitor and went to buy from them instead.
But 90% of the people who make a search for your brand name then go on to buy from you, will do so whether or not you have a paid brand search ad.
Two big questions
If that’s true, it raises two important questions:
- How do we measure that 10% incrementality?
- If brand search isn’t driving 90% of conversions, what is?
This article focuses on the first. We’ll tackle the second next week.
How do we measure incrementality of Paid Search campaigns?
Firstly, let’s start with the 10% number. Where does this come from?
Look in any Adwords account and you will find a paid brand search campaign which delivers large numbers of sales at a very strong CPA. These are serving ads to users who go to Google (other search engines are available, but really Google continues to dominate) and search for your specific brand name.
A lot of the people who make those searches click on your paid search ads, and loads of these people go on to buy products. Average click through rates can be as high as 30%, and conversion rates can be higher than 15%. Both several multiples higher than any other paid campaign would expect to see.
Those high CTR and CVRs net out to very strong CPA or ROAS values.
Clearly a lot of people who search for your brand, end up buying from your brand. Hardly surprising.
But there have always been long standing questions of how many of those people would have bought from you anyway if you turned the paid campaigns off.
They did search for your brand name in the first place after all.
There are a couple of ways of measuring that.
Method 1: Holdout Tests
Simply put, turn off the paid ads and see what happens to both paid brand search revenue and organic brand search revenue. If the paid ads are just canibalising organic then the sum of the two should be relatively unchanged.
Method 2: Marketing Mix Modelling (MMM)
In my view MMM should be an always on for any serious marketer,it is a vital measurement tool to triangulate towards an unknown truth. Run some models over time which look at the impact of changes in paid brand search spend and their impact on overall revenue. (Brand Search is a tricky element of MMM as the correlation will be high, but the causality is often low. You need to run a nested approach to these models, let me know if you are interested and I can write a different post which goes into a bit more depth on these nested structures, it gets quite complicated…)
I have run a lot of these tests over the years. Dozens of holdout tests, and hundreds of MMM outputs.
Two examples below:
Holdout test | During test period Paid Brand Search ads were paused. Post test Paid Brand Search ads were re-activated.
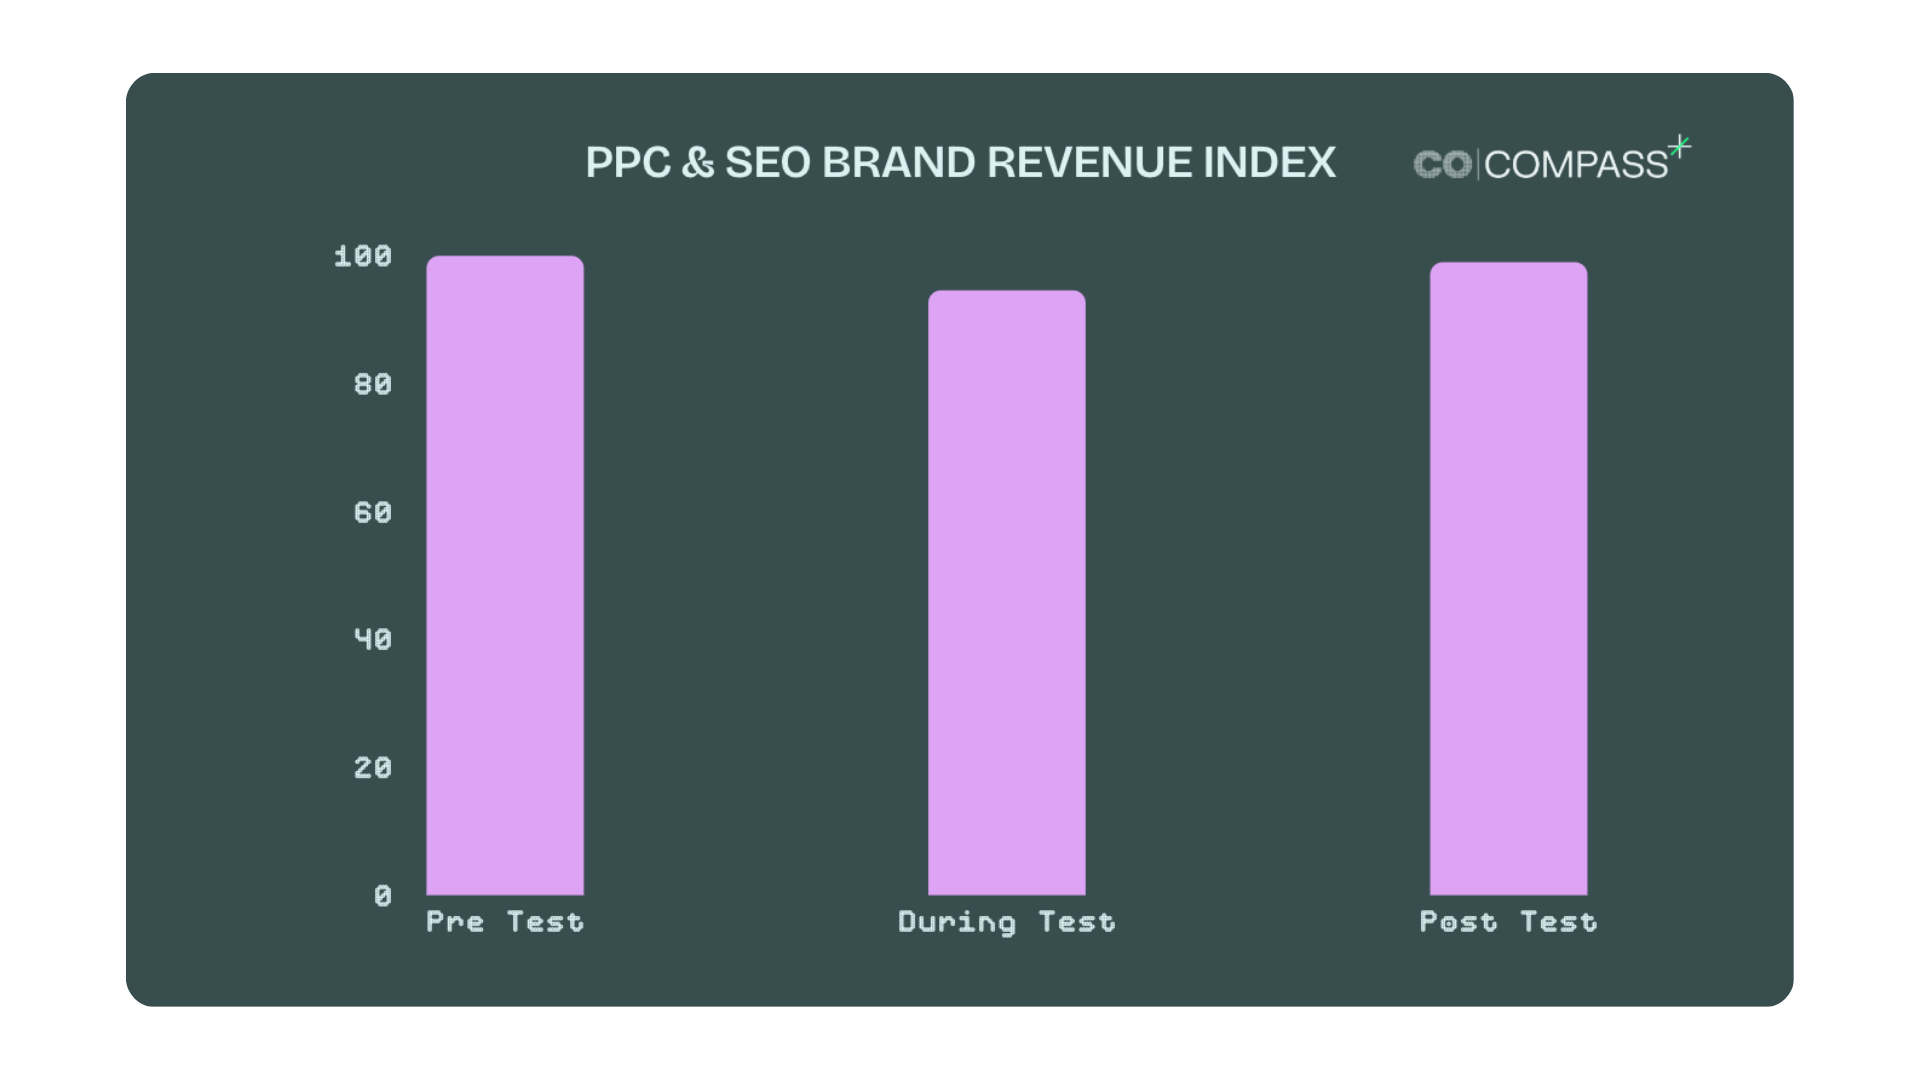
This graph shows index values of total revenue for paid brand search and organic brand search attributed revenue. All values are indexed to the pre test period average. (The real analysis was done on absolute numbers, but to maintain transparency these graphs share indexes.)
During the test revenue dropped by 5%. Post test, when campaigns were reactivated, the total revenue goes back to previous levels.
These graphs show indexes, but the absolute revenue volumes across these time periods were quite consistent. There were no other significant external changes during this timeframe.
When you split those revenue indexes by type it looks like this:
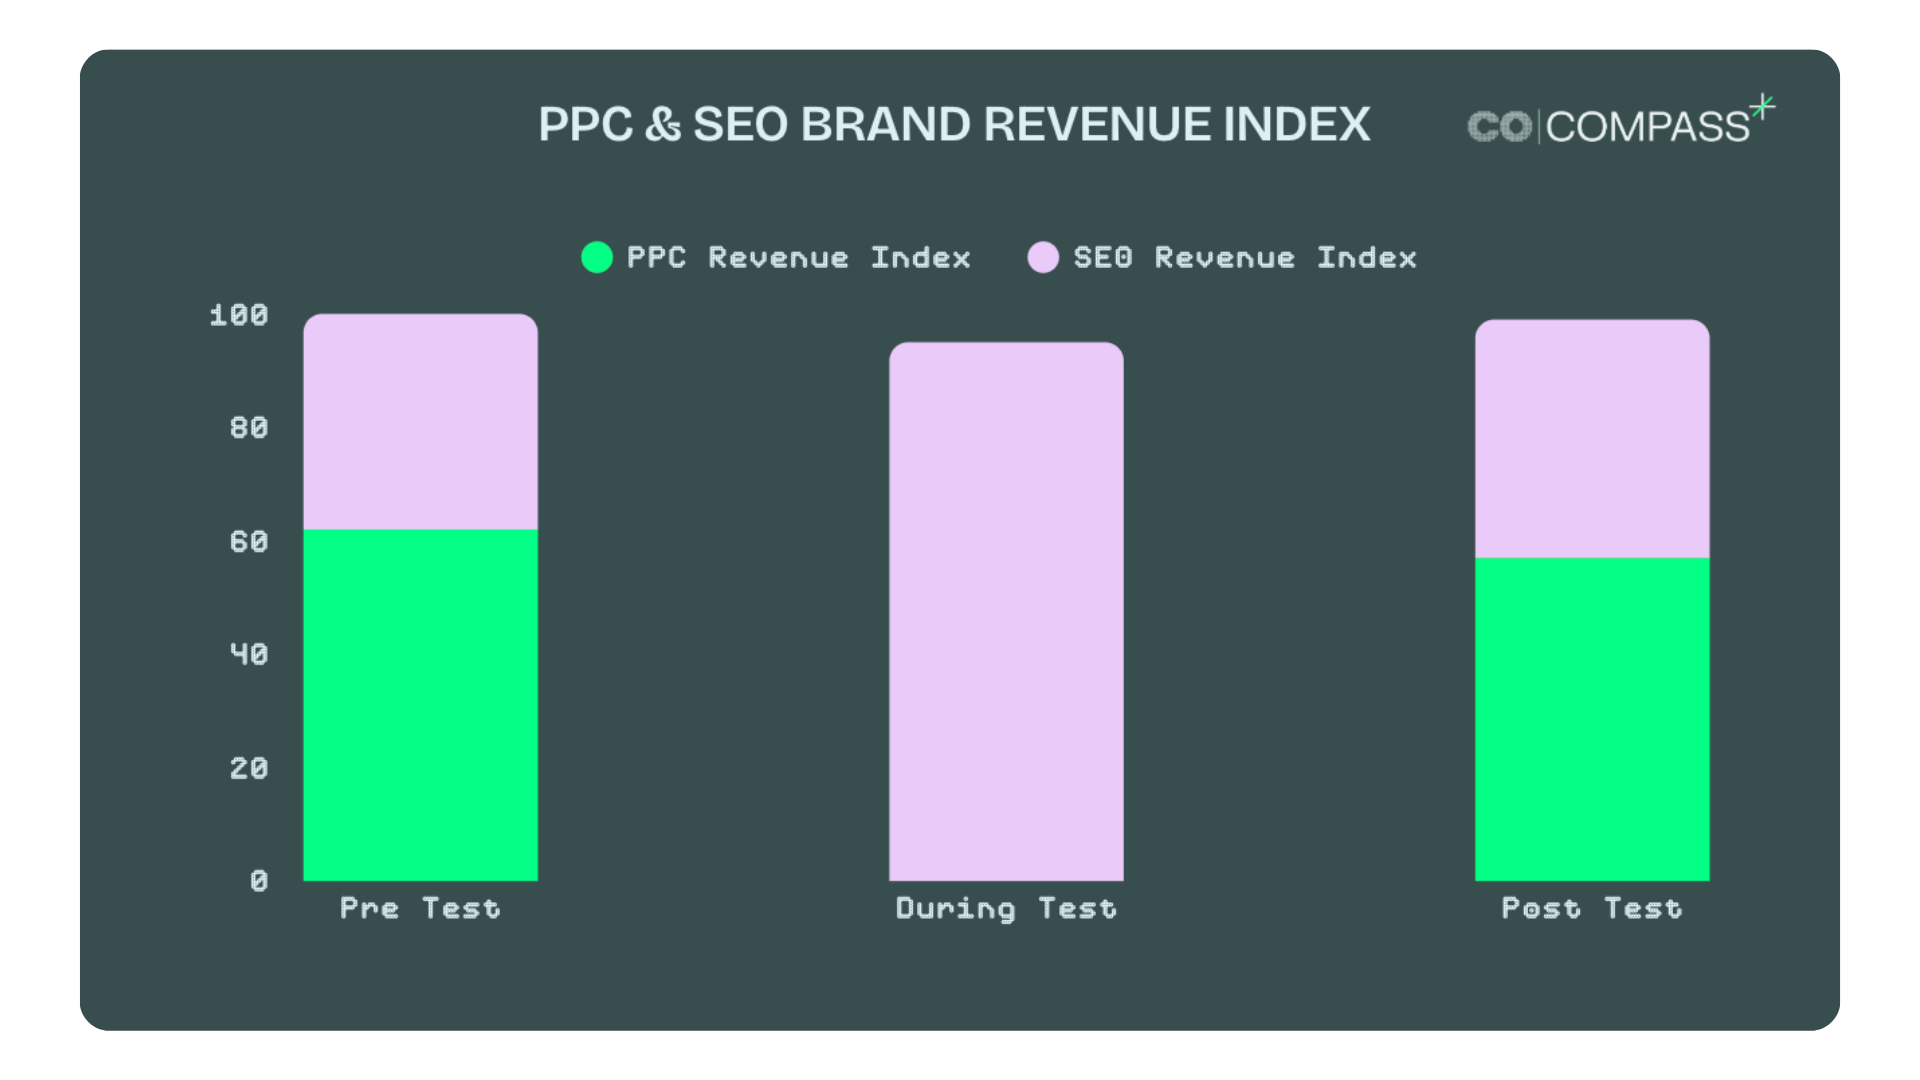
Obviously with Paid Brand Search campaigns paused that revenue drops to zero, but the SEO revenue increases from 38 to 95.
PPC revenue reduces from 62 to 0. But 57 of it (removing the 5% net reduction) is redirected to SEO brand revenue.
57/62 = 92%. So, in this uplift study, 92% of the Paid Brand Search Revenue is non incremental.
Gives us 8% Paid Brand Search incrementality.
Let’s take an example from the other method: MMM (Marketing Mix Models)
Measuring Brand Search in MMM is tricky. MMM runs through regression models, which are essentially time series correlation models.
And the correlation between Brand Search clicks (or spend) and conversions is high. So a simple, flat model will show a very strong impact of Paid Brand Search. (Often very strong. Showing the largest paid media channel with enormous ROAS numbers.)
But we know that a lot of this activity is navigational rather than causal (as our holdout tests show.) So we need to be able to identify the real driver of this activity, and separate out the causal, incremental, contribution of Paid Brand Search.
To do that you need to move away from those flat, simple models. So that we can allow the models to see the real drivers of demand rather than reflecting the correlation between searches and conversions.
There are 3 main ways to do that.
The 3 Approaches
-
Pretend Brand Search doesn’t exist
Remove it from the model, and make the model attribute those sales to the real thing which drove them. This is quite a blunt tool, but it does stop the over attribution to brand search. This is what a lot of self serve MMM SAAS toolkits recommend. It will help understand the contribution of indirect channels, but it doesn’t help us answer the question of paid brand search incrementality.
2. Embed priors into the model to reduce the impact of Paid Brand Search
This is the solution used by a lot of SAAS MMM providers. Bayesian modelling allows MMM to embed prior knowledge into the model build. So rather than the models just looking for a relationship in the data itself, they are also told “we expect this value to be approximately x”. The model then looks for a correlation number in the data, then tries to match it to the prior value. So if the prior says ROAS should be between 8 and 10, and the correlation suggests a ROAS of 30, then the prior will pull that ROAS down towards 10. This again helps to limit the impact of Paid Brand search and helps to identify other indirect drivers, but the model isn’t actually providing this answer, it is simply reflecting an answer which has been embedded into priors. 10 might be the correct answer, but this hasn’t actually come from the MMM output.
3. Build nested models which look at the drivers of brand search demand
This is the only way to really determine brand search incrementality through MMM. We have the initial MMM output (again let’s assume 30), and we build a secondary model which explains what is driving paid and organic brand search clicks. Those secondary models should show a long term baseline of brand search demand, generated from long term brand equity, then incremental demand generated from market seasonality, other marketing channels (for example brand search is highly reactive to TV and YouTube), PR, Influencers and a number of other factors. When you know how much of this demand is being generated from other areas you can reattribute this value back to those other channels and long term effects. What is left is the net impact of your paid brand search campaigns. This usually attributes up to 90% of brand search impact to other drivers, which would leave us with a net impact of ROAS =3 (30*10%). This method allows us to understand those indirect drivers, but also gives us the benefit of actually modelling the paid brand search impact. So rather than excluding (1) or hard coding (2) the paid brand search impact, we are actually measuring it.
So what does that look like in practice?
The below example runs through how we work paid brand search into these nested MMM structures.
This is for a high consideration, high price point purchase product. Average consideration time from lead to purchase is 6 weeks, and the target audience is restricted to the top 10% of earners.
When you run a basic flat MMM structure which includes brand search, then any regression model will show very strong contribution from paid brand search (particularly for these high consideration purchases.)
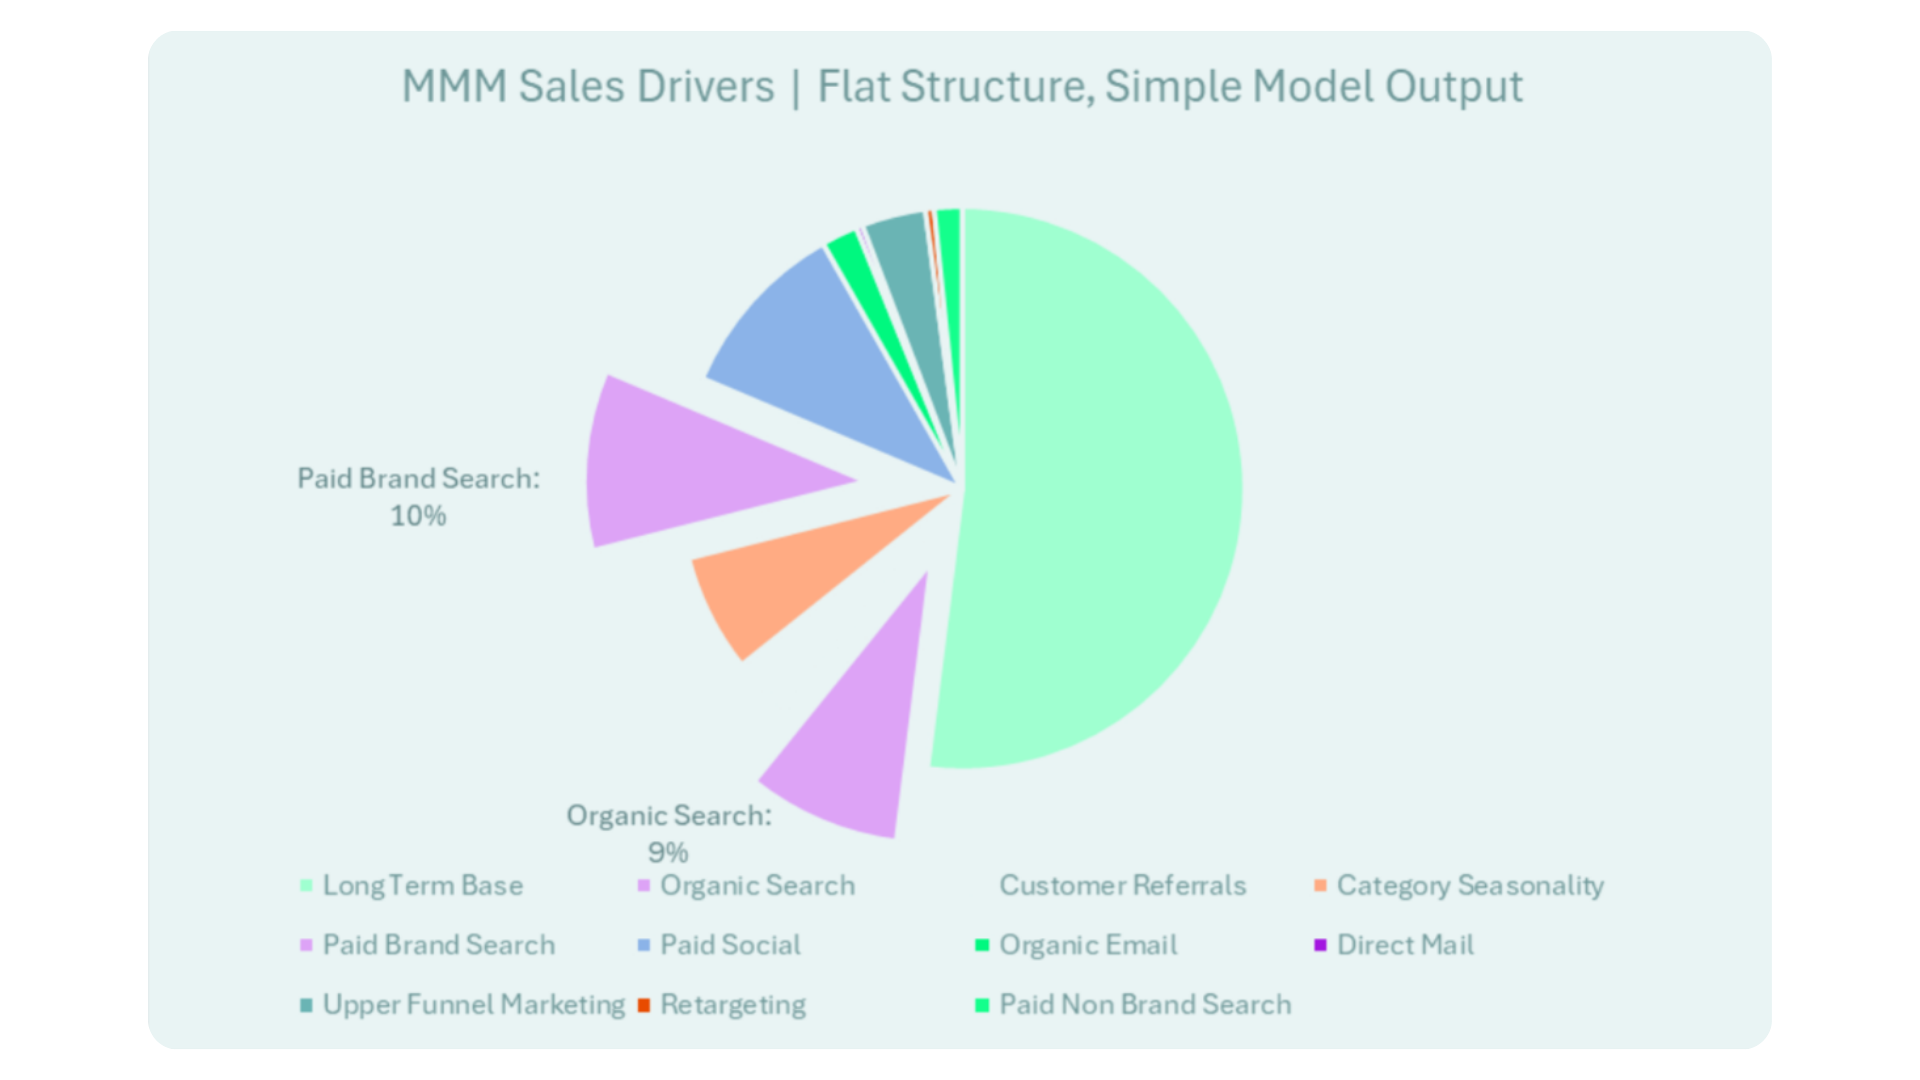
Paid Brand Search shows a 10% contribution to total sales. Even after MMM is accounting for category seasonality and other marketing channels.
Organic Search (of which 90% is on branded queries) shows a further 9% contribution.
For high consideration products, clearly a lot of people who make purchases do so with the last measurable interaction coming from branded search terms.
The raw data shows why these simple models will always highly value branded search terms:
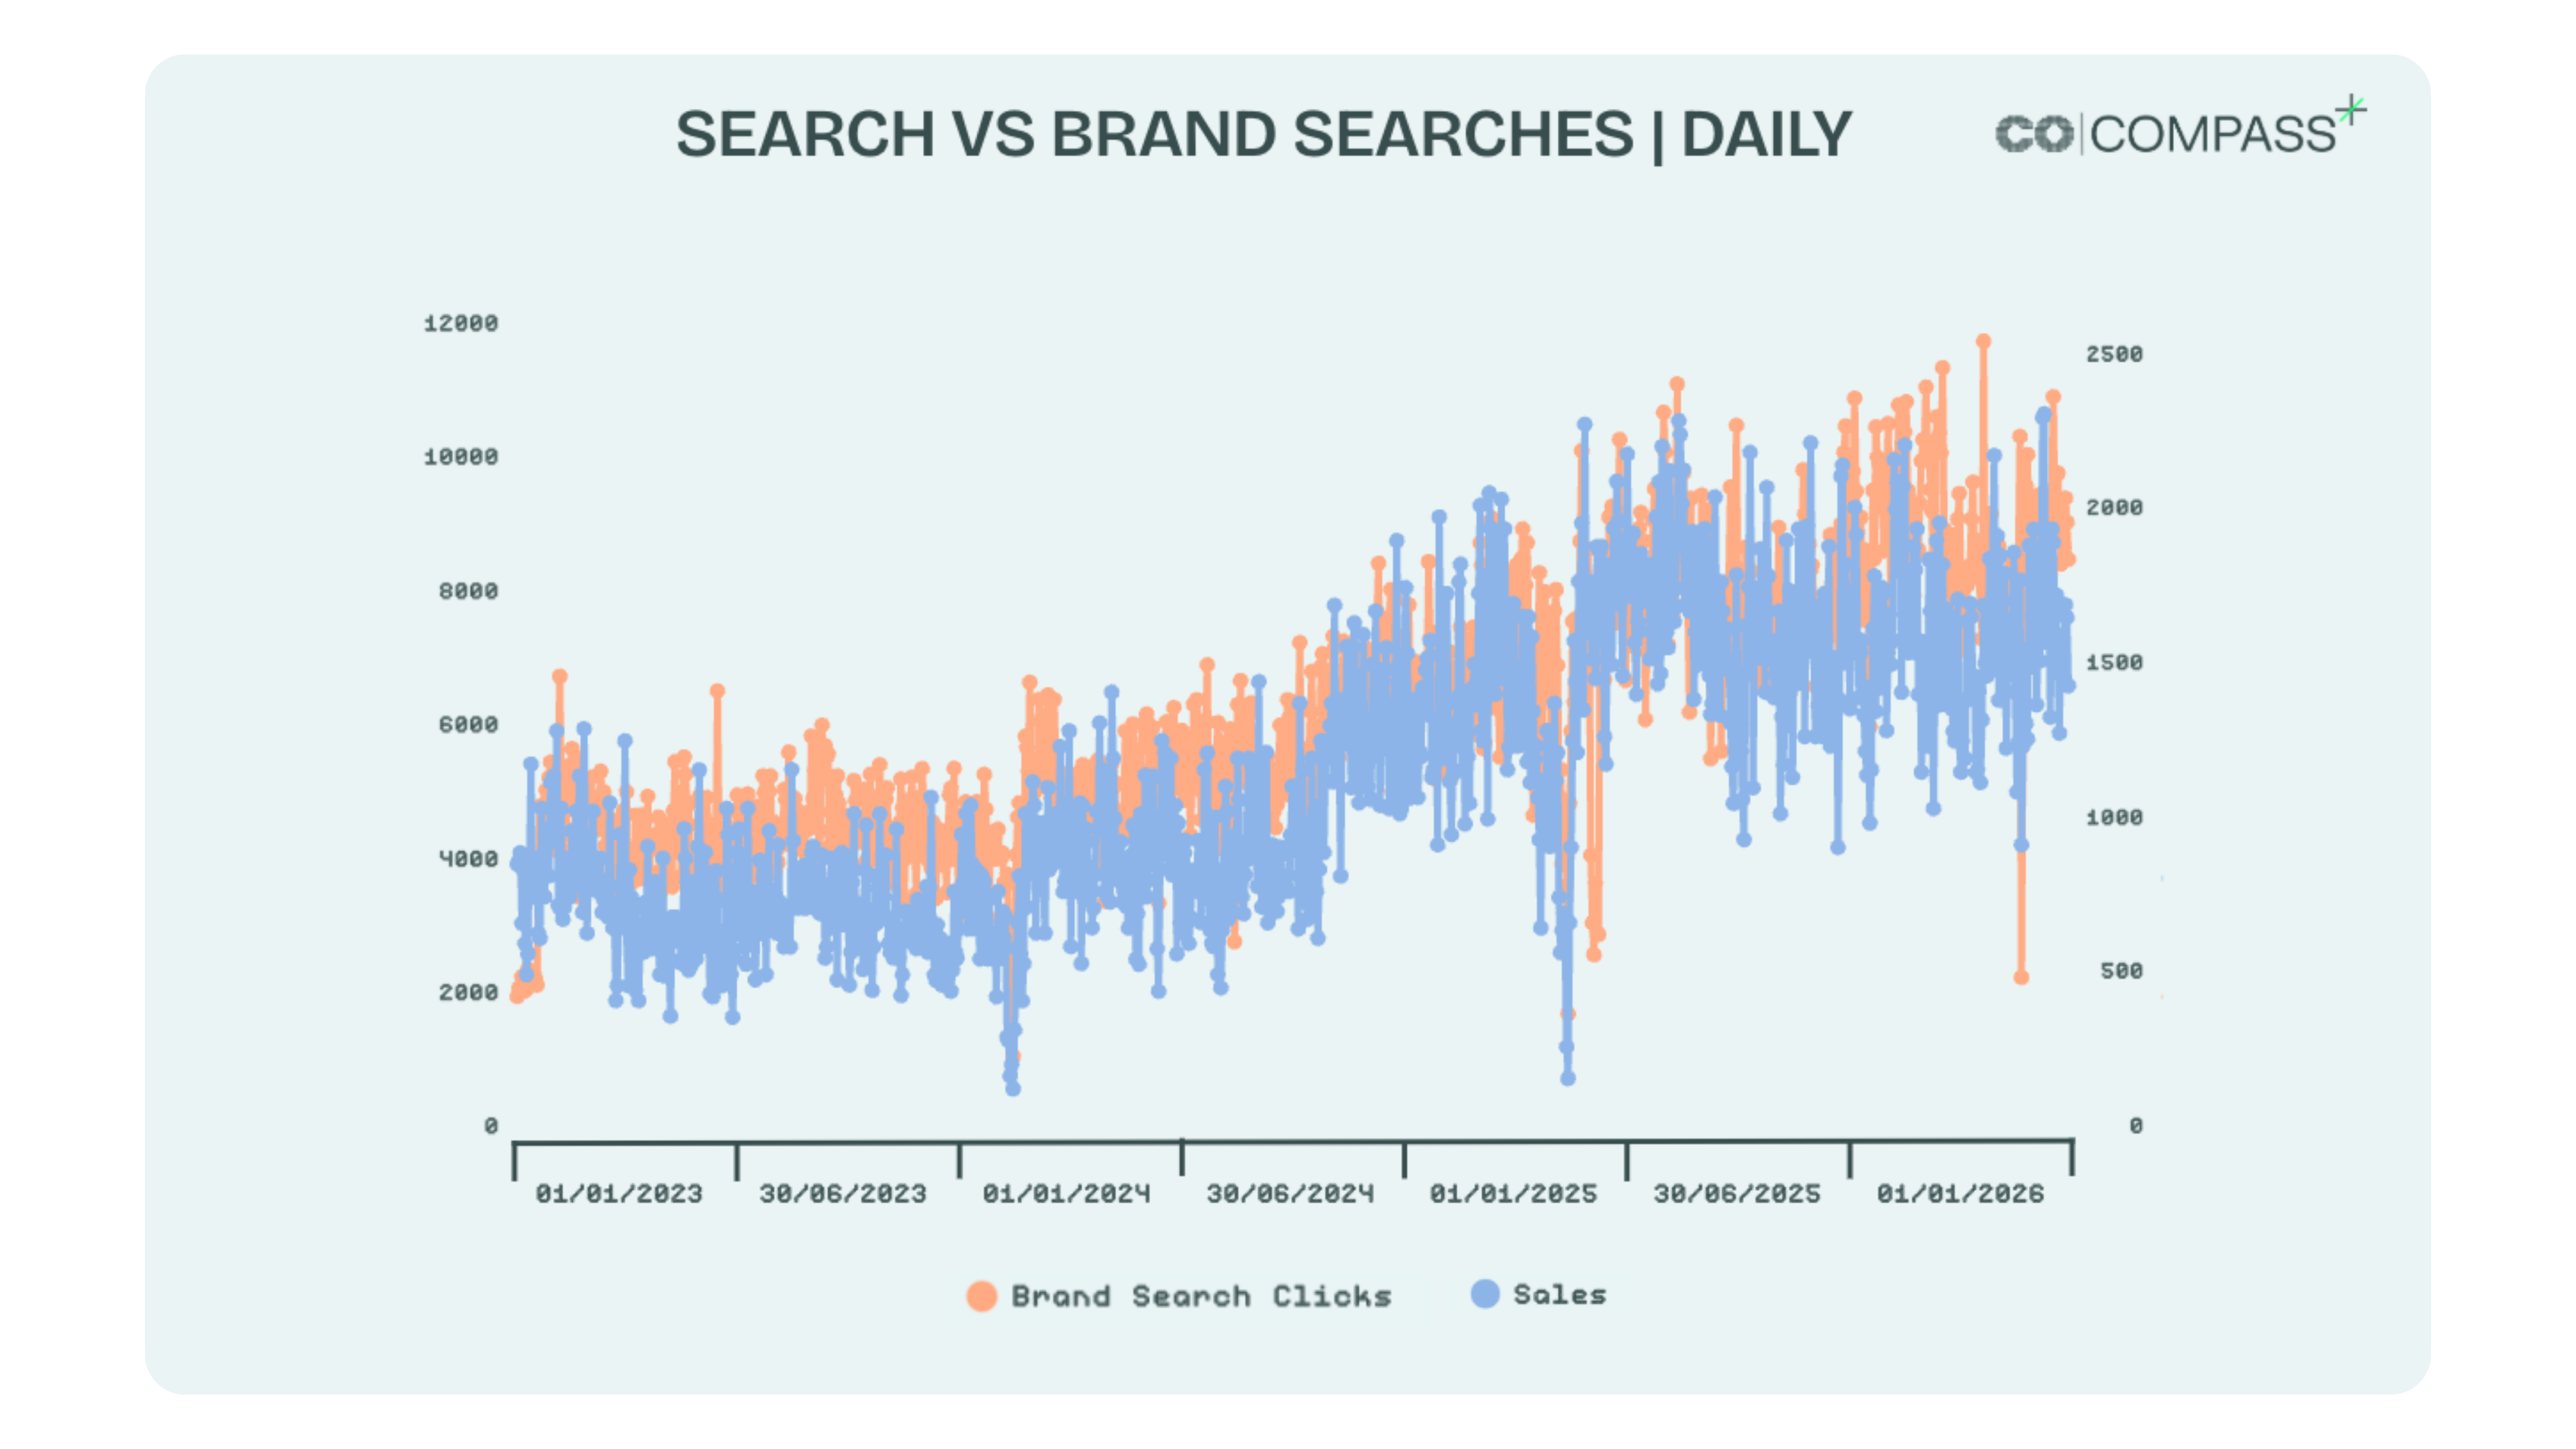
The correlation between sales and brand search clicks is really strong. So any correlation model will show show very strong correlation between brand search clicks and sales.
But we know that the nature of brand searches are that people are looking for your brand.
It is an outcome of marketing as well as paid marketing channel.
So to understand the incremental impact of the actual paid campaign, we need to also understand “what is causing brand searches”?
We can do that through nested models. This gets quite complicated, but I have tried to simplify the language, remove the jargon and talk through in normal marketing language.
We run another regression model (alongside the sales model) which is trying to find the drivers for what makes someone search.
We need to be careful running those nested models, because several other factors will show strong correlation with brand searches (most notably any retargeting campaigns, or any on site behaviours) but will not be a driver of brand searches (as we know through the logic behind which action must have happened first).
To help isolate the potential drivers vs the actions which are correlated but not causal, we think about marketing activities as: User driven or Brand driven.
User driven actions: We can only engage with a user if they do something first. So we can only serve retargeting ads to a user who has already done the thing we want to retarget. Usually a site visit or engagement. We can’t double the audience we want to deliver to unless that audience does something first. In this case, we shouldn’t use these to describe secondary actions like brand searches, because the causality is likely in the other direction.
Brand driven actions: These are actions and engagements that we can control as a brand without requiring the user to engage with us first. Like paid social ads, or TV ads on awareness campaigns. If we want to reach twice as many people through paid social awareness campaigns then we can do that, we just have to spend more money. Twice as many people will see our ads without requiring them to do something first.
Then we have the elements which are not marketing levers, but are still impacts which are impacting how many people search for us. Things like market seasonality. More people will search for christmas trees at christmas. And that will happen whether or not we are running paid search campaigns.
So we also want to understand how much of our search is driven by external factors, like market seasonality, competitors activity, pricing, weather, news cycles. And loads of other things are very specific to individual brands (this is one of the reasons why you should always build these models specific to each brand, a one size fits all doesn’t really work in MMM.)
So we want to find the underlying causes of brand searches from actions which are brand driven, and what the impact is from external factors.
When we run those models we get outputs similar to the below. This is for a travel brand, a high consideration purchase with an average of 6 weeks from first engagement through to purchase.
Note. These type of models rely on having some variation in previous tactics and volumes. If you have always run at 100% impression share (or conversely never run branded search campaigns) then you will not get reliable results from this type of analysis.
We have the contribution from our paid brand search clicks in the simple model (reminder that this was at 10%)
But we also know that 90% of those brand search conversions is were actually from things outside of what we did in paid search campaigns.
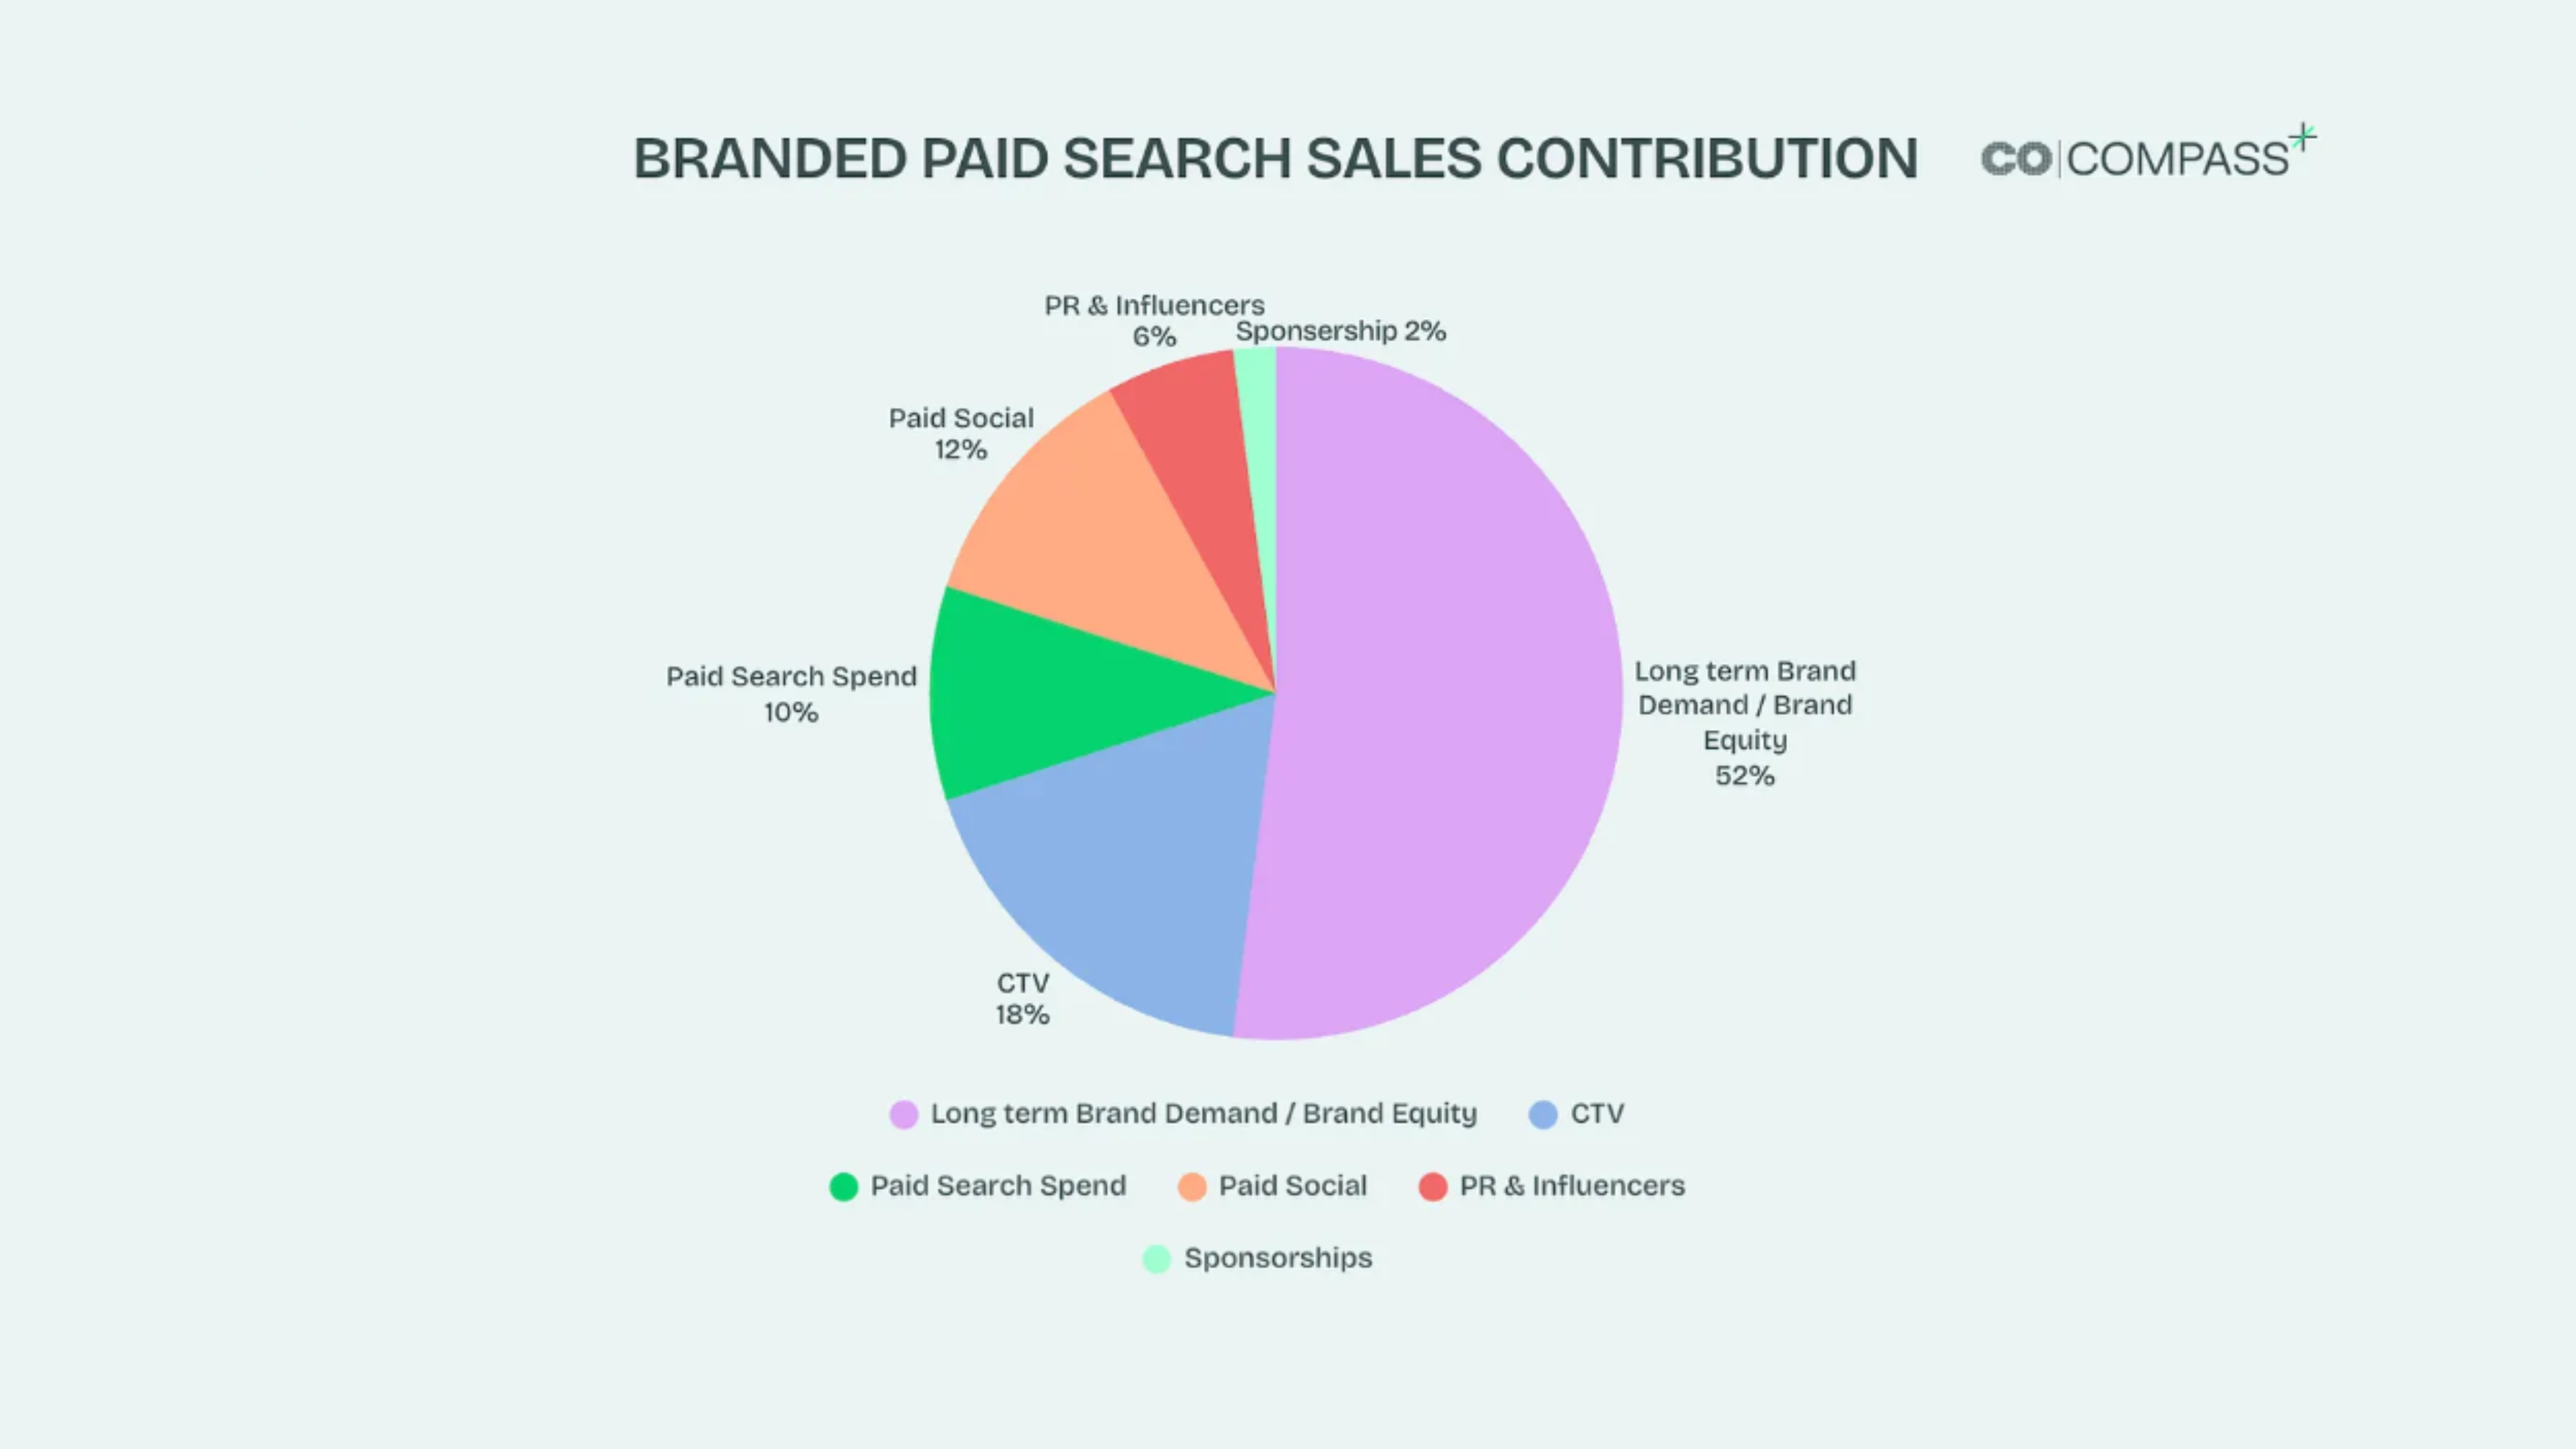
52% of it is our long term brand equity. Turn off everything in marketing and that 52% of brand searches still exists.
12% is from paid social campaigns. These people are buying through search links, but only show up in those search listings because they found us on paid social.
Similarly 18% of the paid search actions are actually driven from CTVcampaigns
10% came from what we did in paid brand search campaigns. So if we turned off the paid brand search campaigns but kept all the other marketing activity running then we would expect to keep 90% of the brand paid search conversions.
This gives us our true incremental contribution for paid brand search activity at 10%. Very similar to the answer we got through the other holdout test method.
But validated through two different measurement approaches.
And measurement approaches which are truly independent of each other (there are some alternative ways of building MMM which hard or soft codes these other values into the outputs through priors)
So while the top level model suggested 10% of our total sales were reliant on paid brand search campaigns (a huge contribution, and by far the biggest marketing input), when we run the nested model structure we find that actually this is only 1% (10% of 10%)
Suddenly CTV and paid social are more responsible for the conversions which show up in branded search, than anything we do within branded search campaigns.
We run a lot of these models and tests. These results are very consistent across brands and categories.
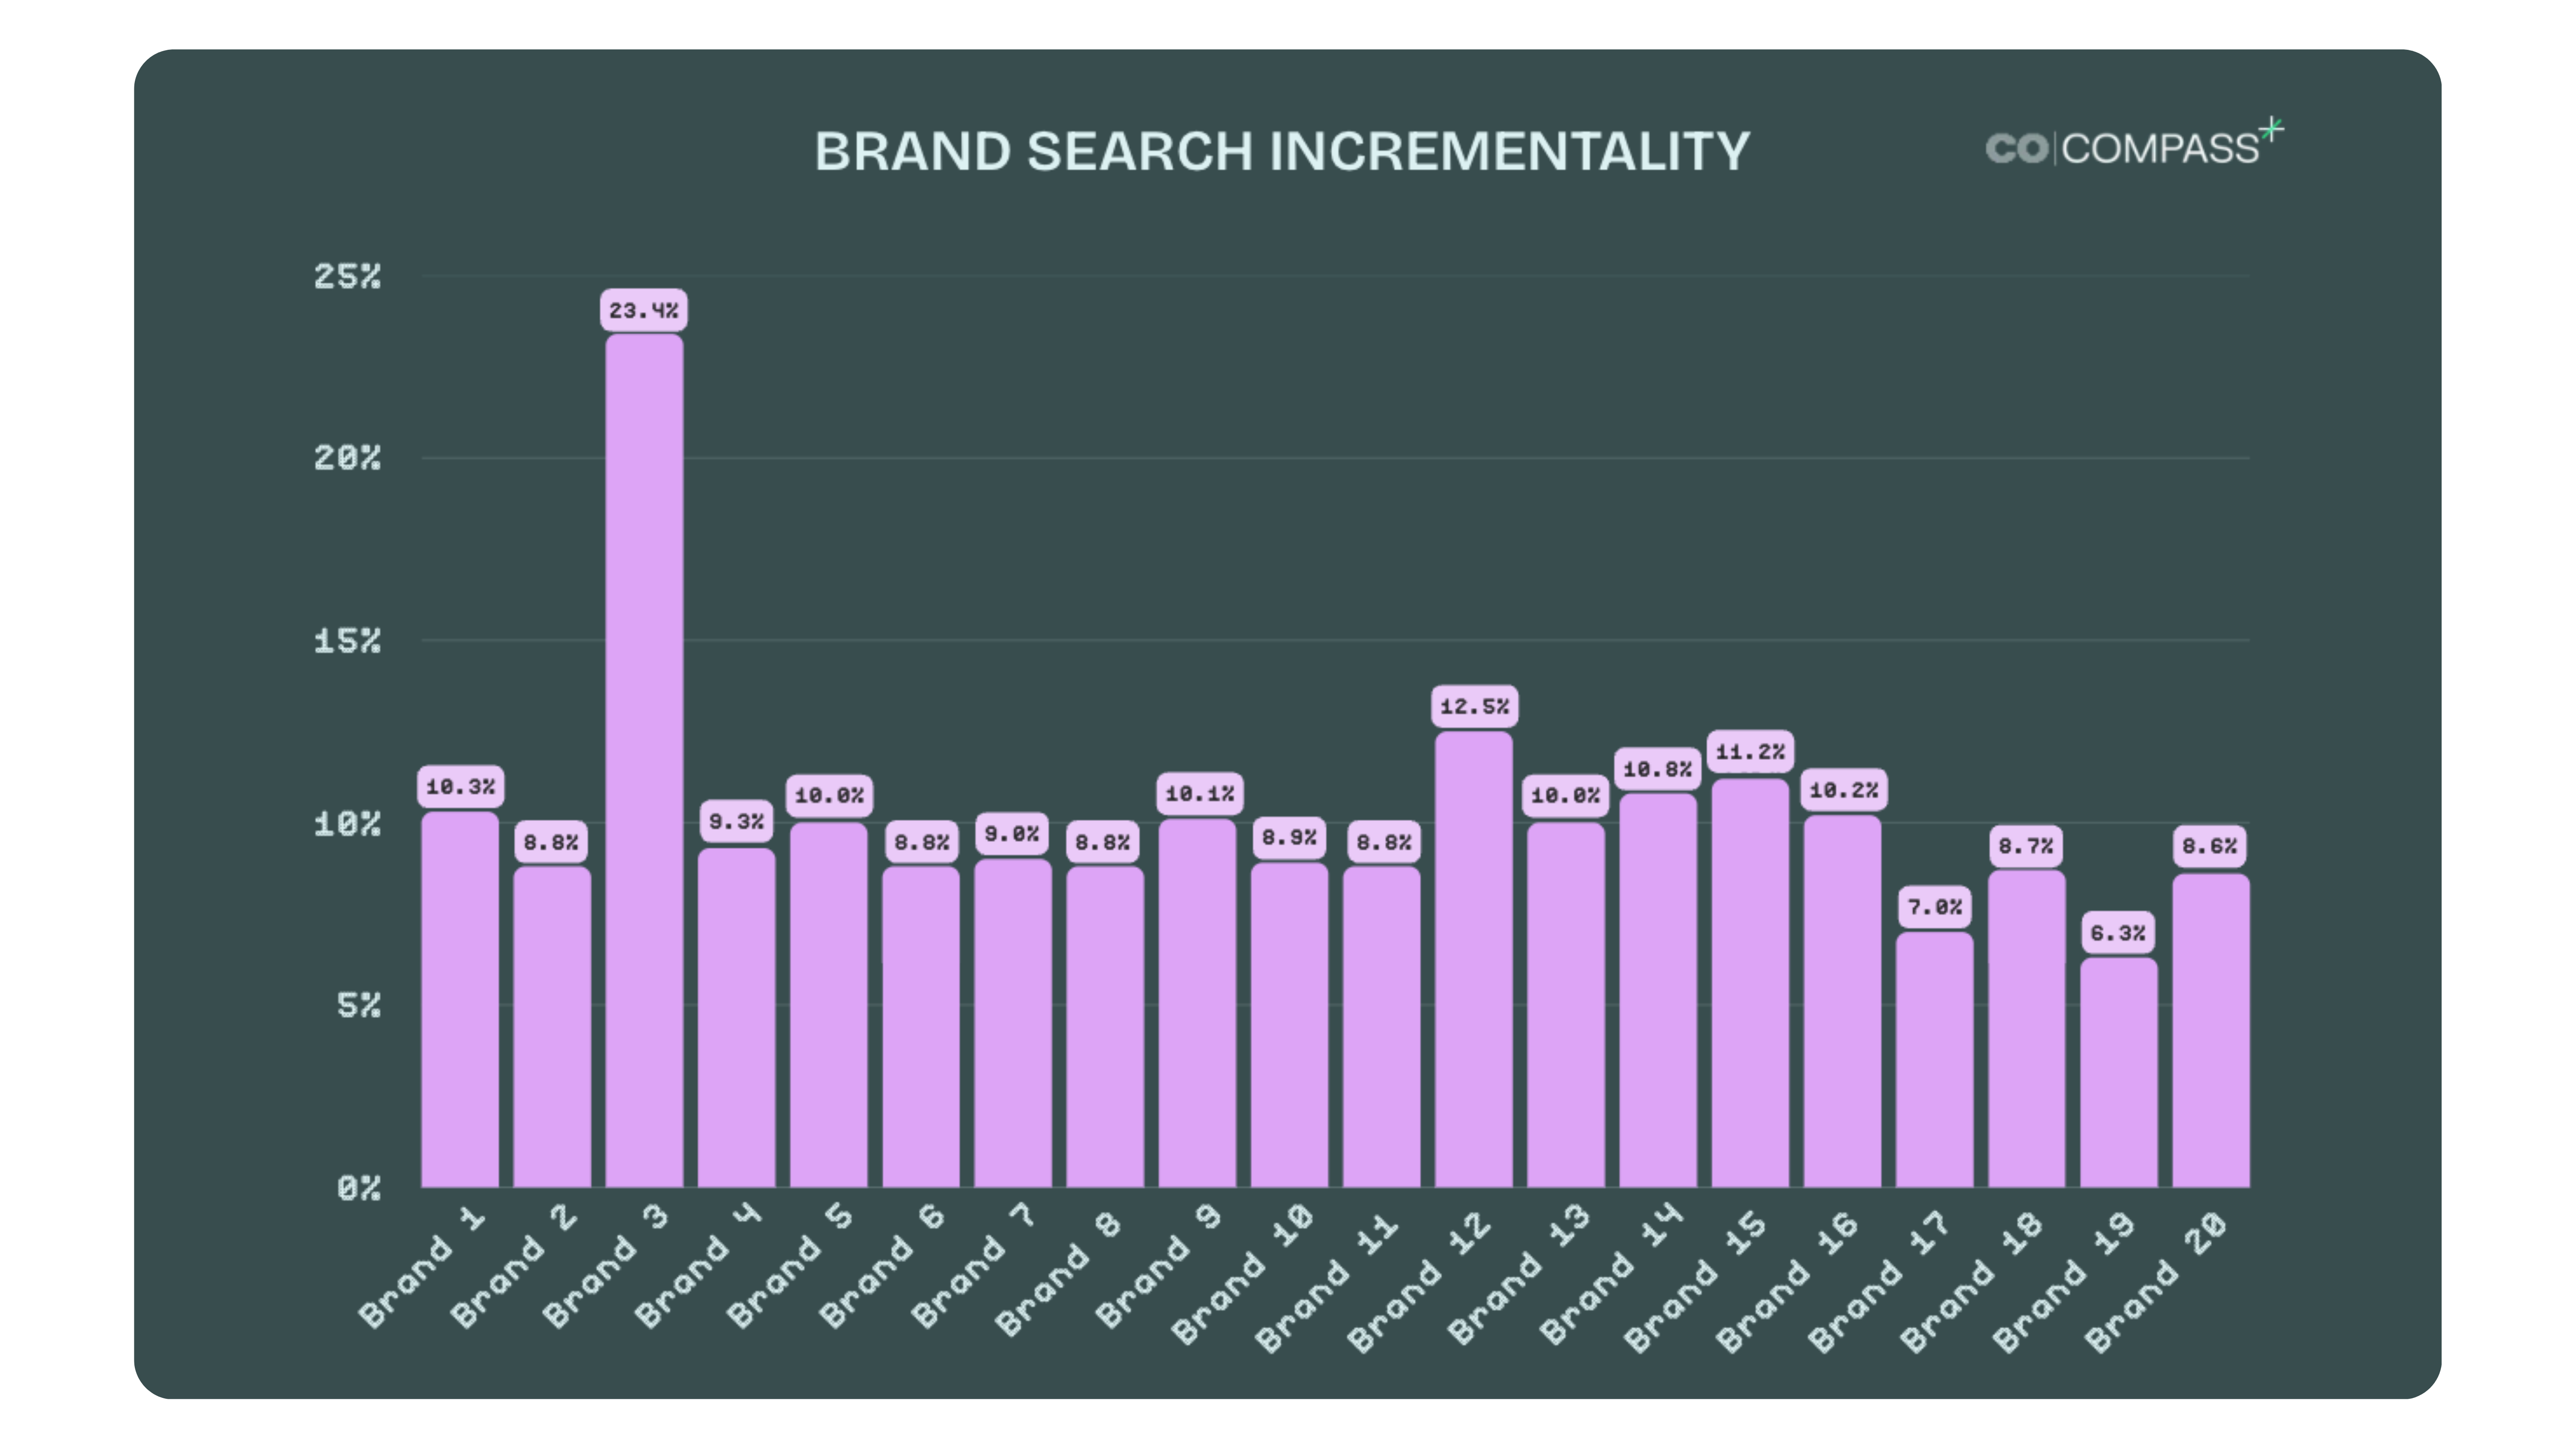
We can see this across 20 brands of a wide variation of sizes and categories:
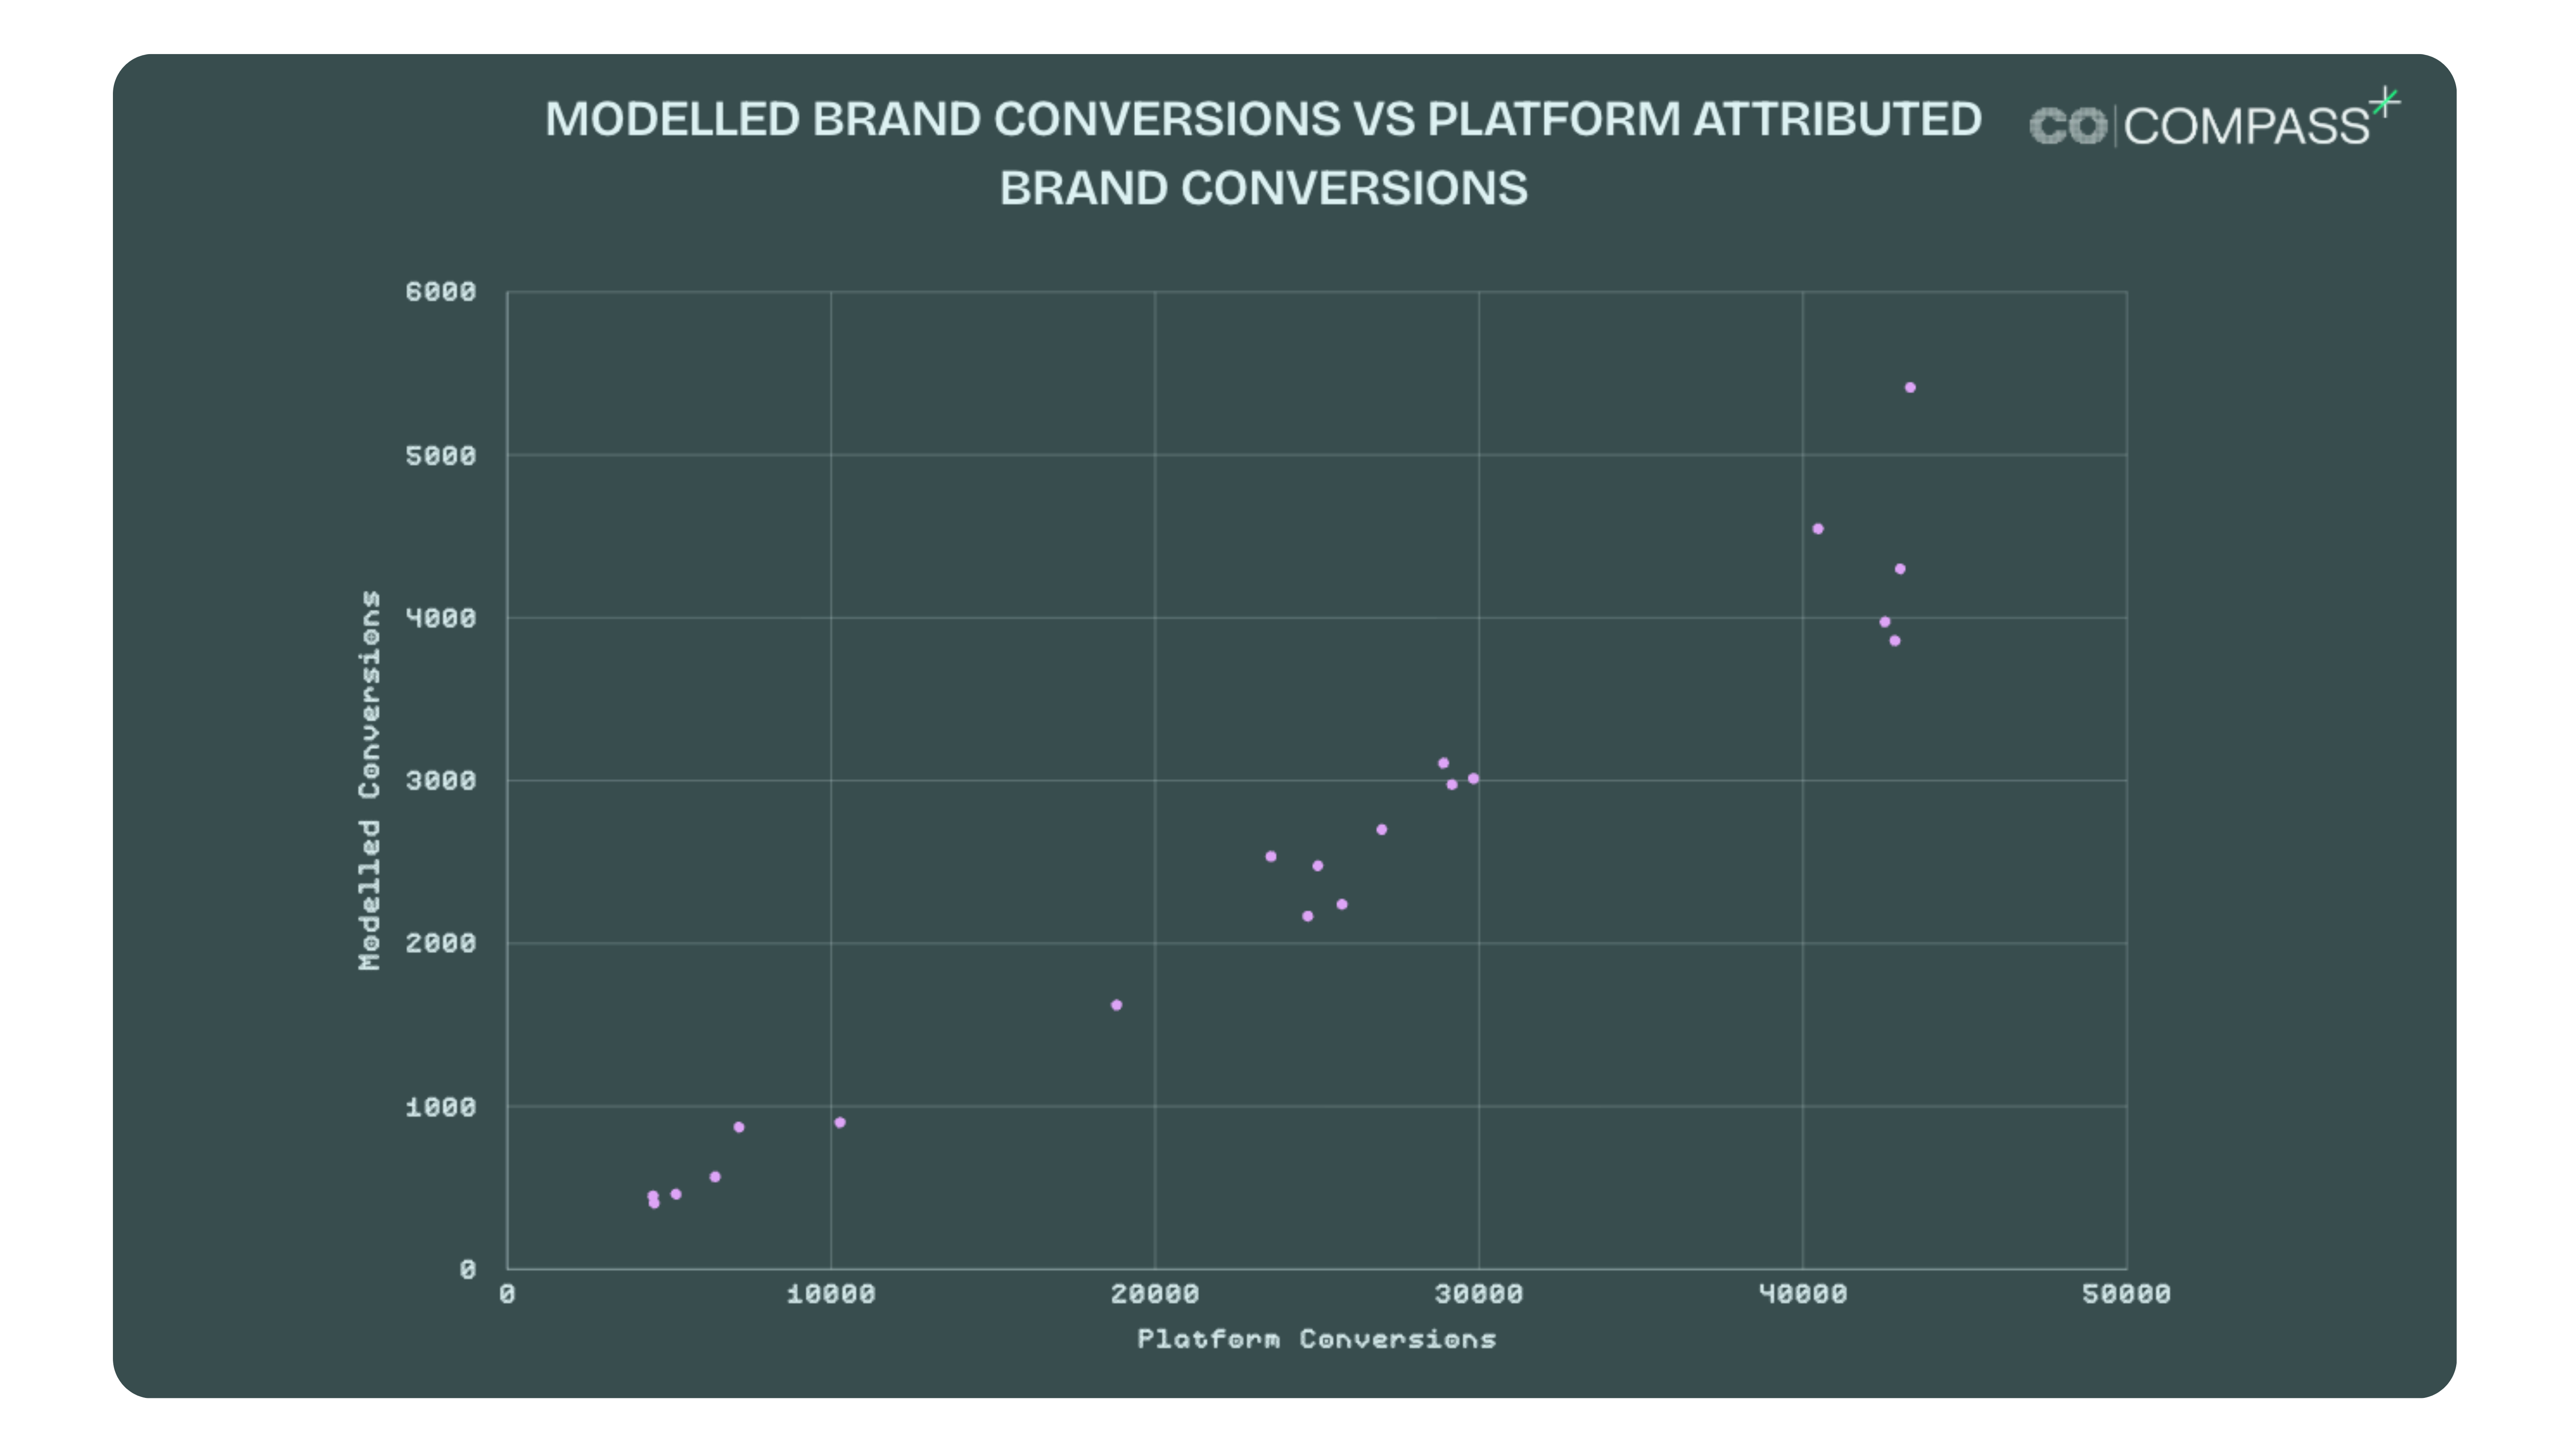
The volume of branded search conversions is highly varied, minimum at 4,152 conversions and a maximum at 43,313 conversions.
But all of them show significantly weaker modelled conversions after we run through the nested models.
Average incrementality is 9.68%
85% of brands see incrementality between 8% and 13%
There is only really one outlier at 23% incrementality, which happens to be the smallest brand in the sample set.
Choosing The Right Method:
Both methods give us a good view of the real impact of paid brand search campaigns.
Both also have pros and cons.
Turning off your campaigns has opportunity cost. If they are 10% incremental, then turning that campaign off cost you 10% of conversions over the test period.
And you need to turn it off for long enough to get statistical significance, which could be expensive.
You also need to restrict other changes during that test period. Which is both difficult and costly.
Running nested regression models is complicated, and requires past variation in the data. We have to have made changes in the past, but we can measure the past without creating more opportunity cost. There is also a greater depth of understanding needed to interpret these results compared to a simple on vs off test.
Having both options in your toolkit gives you the flexibility to use the right one for the right circumstances, and potentially use both to see if you get the same answer. If you get the same response from both methods (and keep them both independent of each other), then your confidence should rise significantly!