The board wants numbers. They want to see green arrows on a weekly dashboard. It is the rhythm of corporate life.
But when you apply that same weekly scrutiny to every single channel in your marketing mix, you aren’t just measuring performance. You are actively suppressing it.
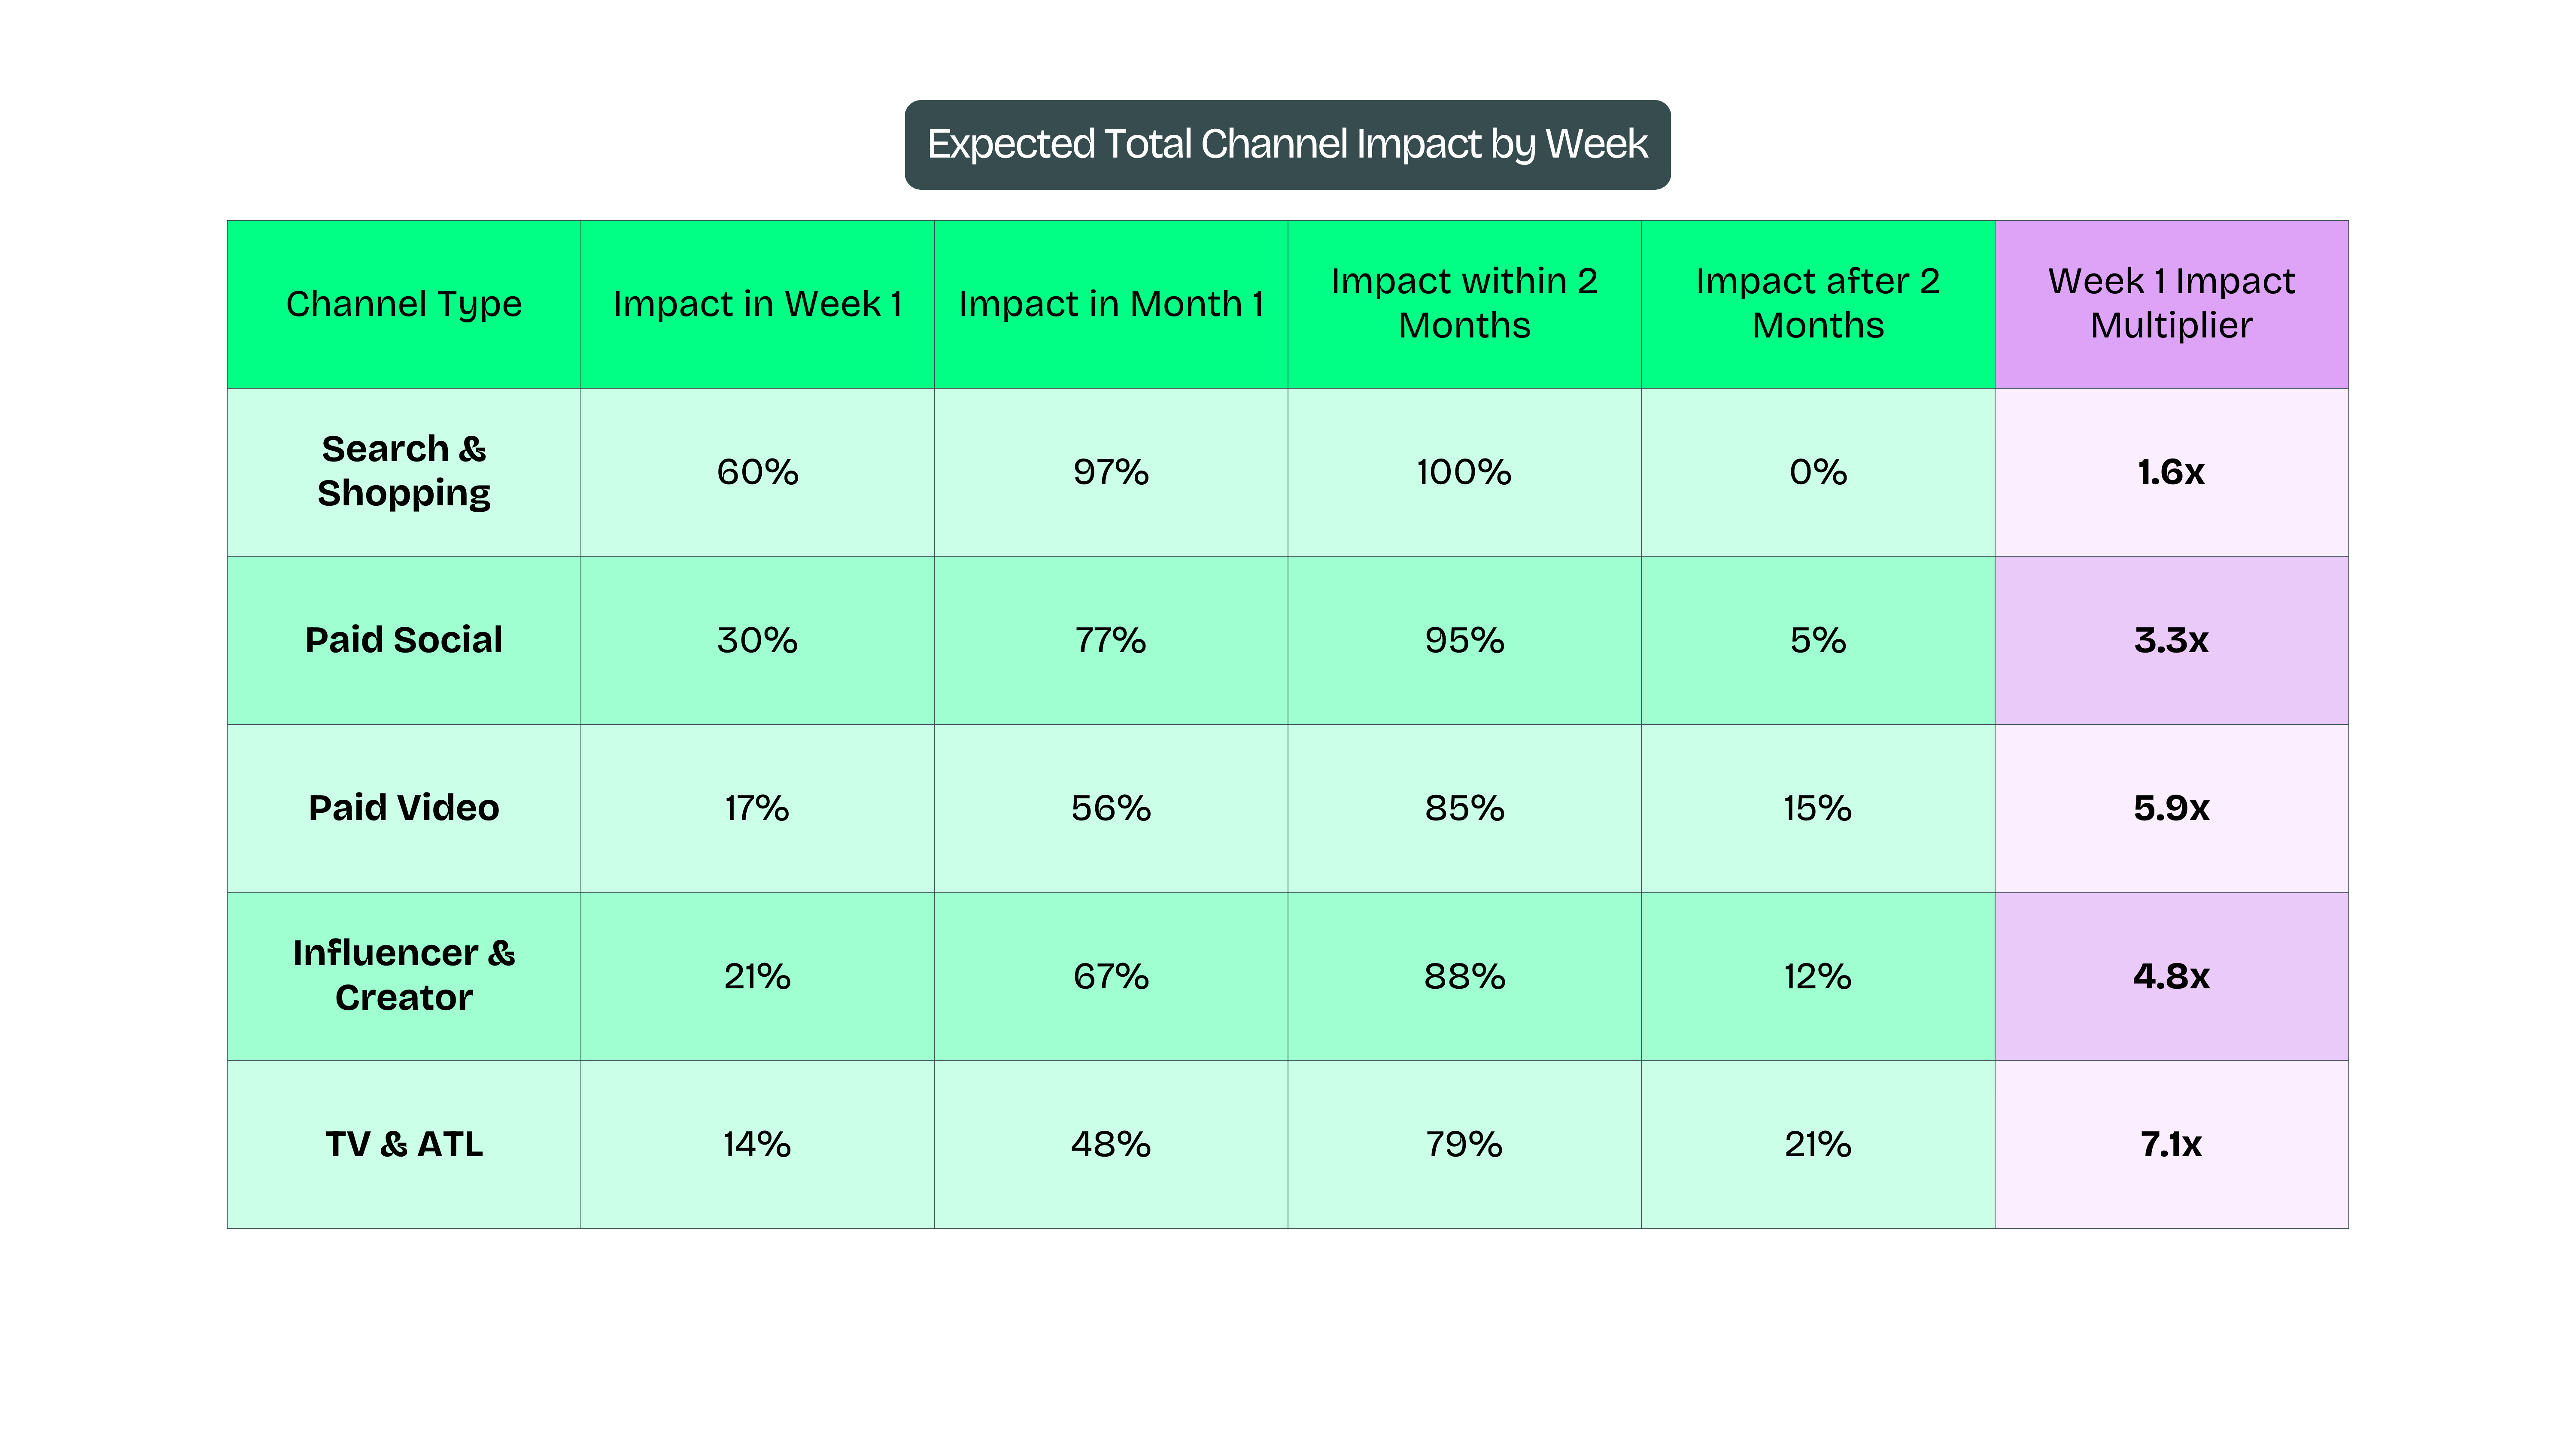
We know that not all channels drive results at the same speed. Yet, the industry standard remains fixed on “daily,” “weekly,” and “monthly” reporting cycles. We look at delivery on fixed periods for customer actions delivered across that same narrow window.
When you stop to think about it, this approach is not just bizarre. It is a fundamental calculation error that costs businesses millions in lost potential.
The Disconnect Between Strategy and Scrutiny
Here is the reality for you: immediate gratification is rarely the path to sustainable revenue.
When we intentionally shift budget from channels that drive results “this week” (like bottom-of-funnel PPC) to channels we expect to drive results “over the next 3 months” (like influencer activation or brand building), we know that weekly efficiency will decline.
That is not a failure of execution. It is a reflection of human behaviour.
However, the weekly report does not account for these human behaviours. It only accounts for the immediate past. The scrutiny intensifies. The panic sets in. And often, the strategy is pulled before the payback period even begins.
So, how do we manage that end-of-week scrutiny? How do we buy the time required for greatness?
How Long Do I Need To Wait To See The Effect?
The Insight: Model the Lag, Don't Fear It
You cannot manage what you do not measure. But you also cannot measure a marathon using a stopwatch designed for a sprint.
To conquer this, we must shift the conversation from “What happened this week?” to “When will the value arrive?”
We can model the expected payback by week for each channel and campaign type. This provides a better understanding of how long each channel takes to drive its total value.
This is not about guessing. It is about calculating the velocity of your revenue, and understanding the dynamics of the humans who make the purchases.
When we have advance knowledge of the expected paybacks of these channels over future weeks, we can adjust these weekly performance numbers to predict future performance. This turns your report from a look-back mirror into a forecast.
Framework: 4 Steps to Build Your Payback Model
Stop reacting to red numbers and start engineering your growth trajectory. Here is how you operationalise this shift:
1. Audit Channel Velocity
Analyse your historical data to determine the average “time-to-value” for each channel.
- Performance Search: High velocity (Days 1–7)
- Paid Social (Direct Response): Medium velocity (Days 7–30)
- Influencer/Brand: Low velocity (Days 30–90+)
If you do not know your specific benchmarks, start with industry standards for your sector (longer consideration businesses naturally have longer lags) and refine as you gather data.
2. Model the Payback Curve
Create a predictive model that maps spend against expected return over time. We do this as standard within our COmpass models.
If you spend £50k on a creator campaign in Week 1, do not forecast £100k return in Week 1. Forecast the curve: £10k in Week 1, £30k in Week 2, £60k in Week 3. This sets the expectation for the board before the money is even spent.
3. Adjust the Weekly Narrative
When presenting the weekly report, split your view.
- Realised Revenue: What banked this week.
- Projected Revenue (The Pipeline): What the activity from this week will generate over the next 60 days based on your model.
This eases the scrutiny over the Week 1 report after a significant strategic shift. And mitigates panic when week 1 returns £10k in revenue, as this falls in line with our lagged channel expectations.
4. Validate and Recalibrate
Predictive models are only useful if they are accurate. You must validate that predicted performance later. Did the creator campaign actually deliver that £60k in Week 3? If yes, your confidence grows. If no, you adjust the model. This is deliberate, iterative improvement.
Evidence: The Cost of Short-Termism
Consider a premium travel subscription brand. They rely heavily on Meta ads for immediate sign-ups.
To grow market share, they need to diversify into podcast sponsorships and high-tier influencer partnerships.
- The Old Way: They launch the podcast ads. Week 1 CPA spikes by 40%. The CMO gets nervous. The CFO asks questions. They pause the campaign in Week 3. Result: Wasted spend, zero growth.
- The Charlie Oscar Way: We model that podcast audio has a 6-week attribution lag. We forecast the Week 1 CPA spike. We assure the stakeholders that this is part of the trajectory. By Week 8, the blended CPA has dropped below the original baseline, and volume has increased by 20%. Result: Market conquered.
These paybacks change business by business and campaign by campaign. But the principle remains: Clarity empowers bravery.
The Bottom Line
You don’t need to choose between performance and brand building. You need a measurement framework that respects the physics of both.
Digital marketing is notoriously complex. But by using logic and simplicity, you gain the confidence to make bold decisions.
Do not let a static spreadsheet dictate your strategy. Define the timeline. Measure the lag. Build the model that allows you to outperform the status quo.
Ready to rethink how you measure success? Let’s redefine your growth trajectory.
Award Winning Thinking
Featured for big wins across Marketing Science, Influencer, Paid Media, Creative, and Consultancy.