
AEO. GEO. AI Search. LLM visibility.
Marketing loves an acronym.
They all basically mean the same thing: When someone asks an LLM (like ChatGPT) “what is the best brand for X”, how do I make sure my brand shows up?
AEO and GEO were the buzziest words of 2025. That won’t fade in 2026. (I’m going to stick with AEO for the rest of this article). The hype around AI continues to grow. Naturally, the industry is obsessed with how brands can win in this new AI-powered world.
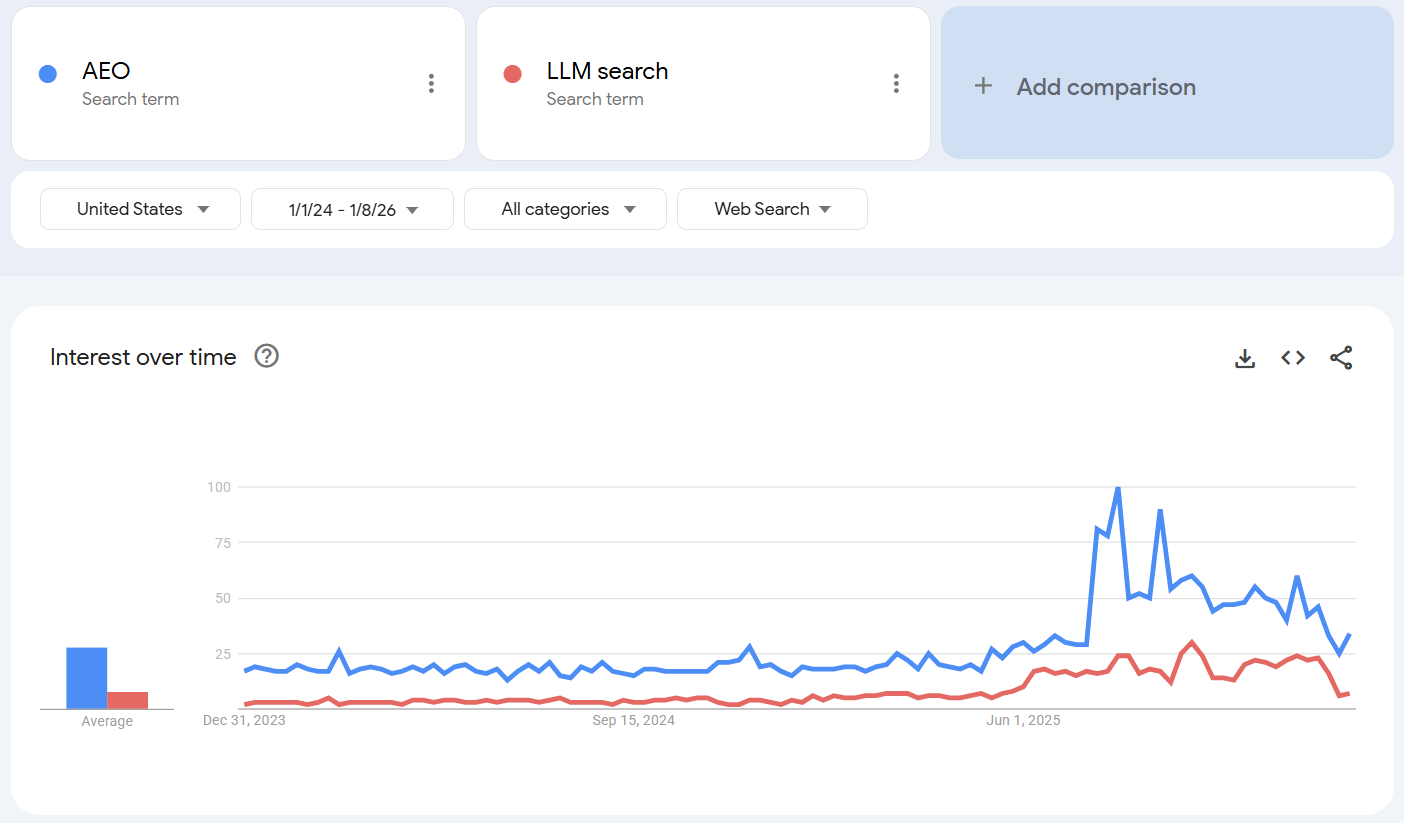
The proof is in the search trends.
Funding is flowing into tech businesses. Companies that monitor brand presence on LLM prompts. Companies building solutions to help brands be more discoverable. This investment hype includes a mix of AI search-native companies like Profound and SEO tech giants like SEMrush who are evolving their offerings.
But the jury is still out.
Does this represent a fundamental change to long-established SEO tactics? How much control do we actually have over this discoverability? And how much actual business impact does that discoverability drive?
You won’t struggle to find opinions. Plenty of people in marketing love to share their views and try to sound clever. (I am aware I am one of them).
So rather than another thought piece, I went back to my roots. I dug into the data. I wanted to answer three questions:
- Is LLM visibility fundamentally different from Search visibility?
- What actually drives LLM visibility? How much control do we have?
- Does it even matter? Does driving stronger discoverability actually drive stronger business performance?
Before we dig into what the data tells us, we need to define a few terms frequently used in the AEO space.
How do we measure AEO / LLM Search presence?
There are an ever-growing number of tools available to measure AEO presence.
I haven’t tried them all, so I won’t play favourites. You can find them easily on Google or ChatGPT. Interestingly, you will get different recommendations for “best AEO tool” from each platform you ask. That already highlights the significant inconsistency on what drives presence across different platforms.
Fundamentally, all these tools work with similar data. They make a number of prompt queries to the LLM platforms and track their responses. Then they aggregate and analyse this data. They give you a summary of how you show up, how your competitors show up, and the citations listed which are driving both you and your competitors. (More on whether these citations are actually “driving” your presence later.)
When assessing AEO presence, most solutions lean towards four main metrics:
- Brand Mention Rate: How frequently your brand shows up against the prompts/questions you are tracking.
- Brand Average Rank: When multiple brands are mentioned in the AI response, where do we show up vs competitors?
- Citations: Which web pages are being used by the AI to recommend each brand and drive the mention rate?
- Sentiment: When we are mentioned, is the AI response positive, negative or neutral?
There is then a series of analyses we can use to better understand overall presence and build future strategy. This is specific to each brand but typically includes:
- Share of model presence vs competitors: Similar to share of search. This highlights how often we appear vs key competitors. A very useful metric to highlight changes over time. We will be using this frequently in the rest of this article.
- Presence by prompt type / audience type: Breaking out how strongly we appear on different prompt types and in prompts focused on different audience groups. Useful data to isolate where we are strong and weak. It defines the battlegrounds where we want to improve.
- Citations depth and breadth: Which external and internal sources are driving strong presence for our brand? Which external sources are driving strong presence for other brands where we have weak citation?
If you run this analysis, you can find where you need more or better content. You can build test plans covering everything from onsite content to PR, influencer content, and paid marketing integration.
If those test plans work well, you get better LLM presence. You become more discoverable on AI Search.
So next time someone asks “where should I buy running shoes for trail runs in the UK” (for example), you will show up more often. You get a higher share of model presence.
And you will sell more trail running shoes… Right?
Well. Let’s see what the data says. Let’s go back to our three questions and look at some data.
I have run this analysis across 30 brands in 6 categories. I have intentionally picked the bigger brands in each category where the data is a bit more stable (and where I have much better data access.)
The categories skew across multiple product sets, but they are all in categories that tend to have a bit of research before making a purchase decision.
1. Is LLM visibility fundamentally different from Search visibility?
We know the definitions differ. One measures brand visibility in search engines (primarily Google). The other measures visibility in LLM platforms (like ChatGPT or Gemini).
But is the behaviour different?
Do the brands that show up highest on search really differ from the brands that show up highest on LLMs?
There is research highlighting that the website sources driving search visibility are not the same as the sources driving LLM visibility. (Though there is significant overlap). But notably, a lot of this research comes from the tools and tech focused on AEO, who have just taken multi millions in VC funding. They have a vested interest in highlighting that it is new and different.
What does the actual data say?
We can compare share of AI model visibility against share of branded search volume. This lets us see how the LLM results match or differ from Google popularity.
The graphs below compare relative share of model against share of search for six categories.
These metrics measure different things.
Share of search: How many people are looking for the brand on search engines. An outcome of brand discoverability and awareness.
Share of visibility: How often brands are recommended by LLMs when users ask non-branded questions. A signal of discoverability.
But they both show us the dominant players in key markets, on two key platforms.
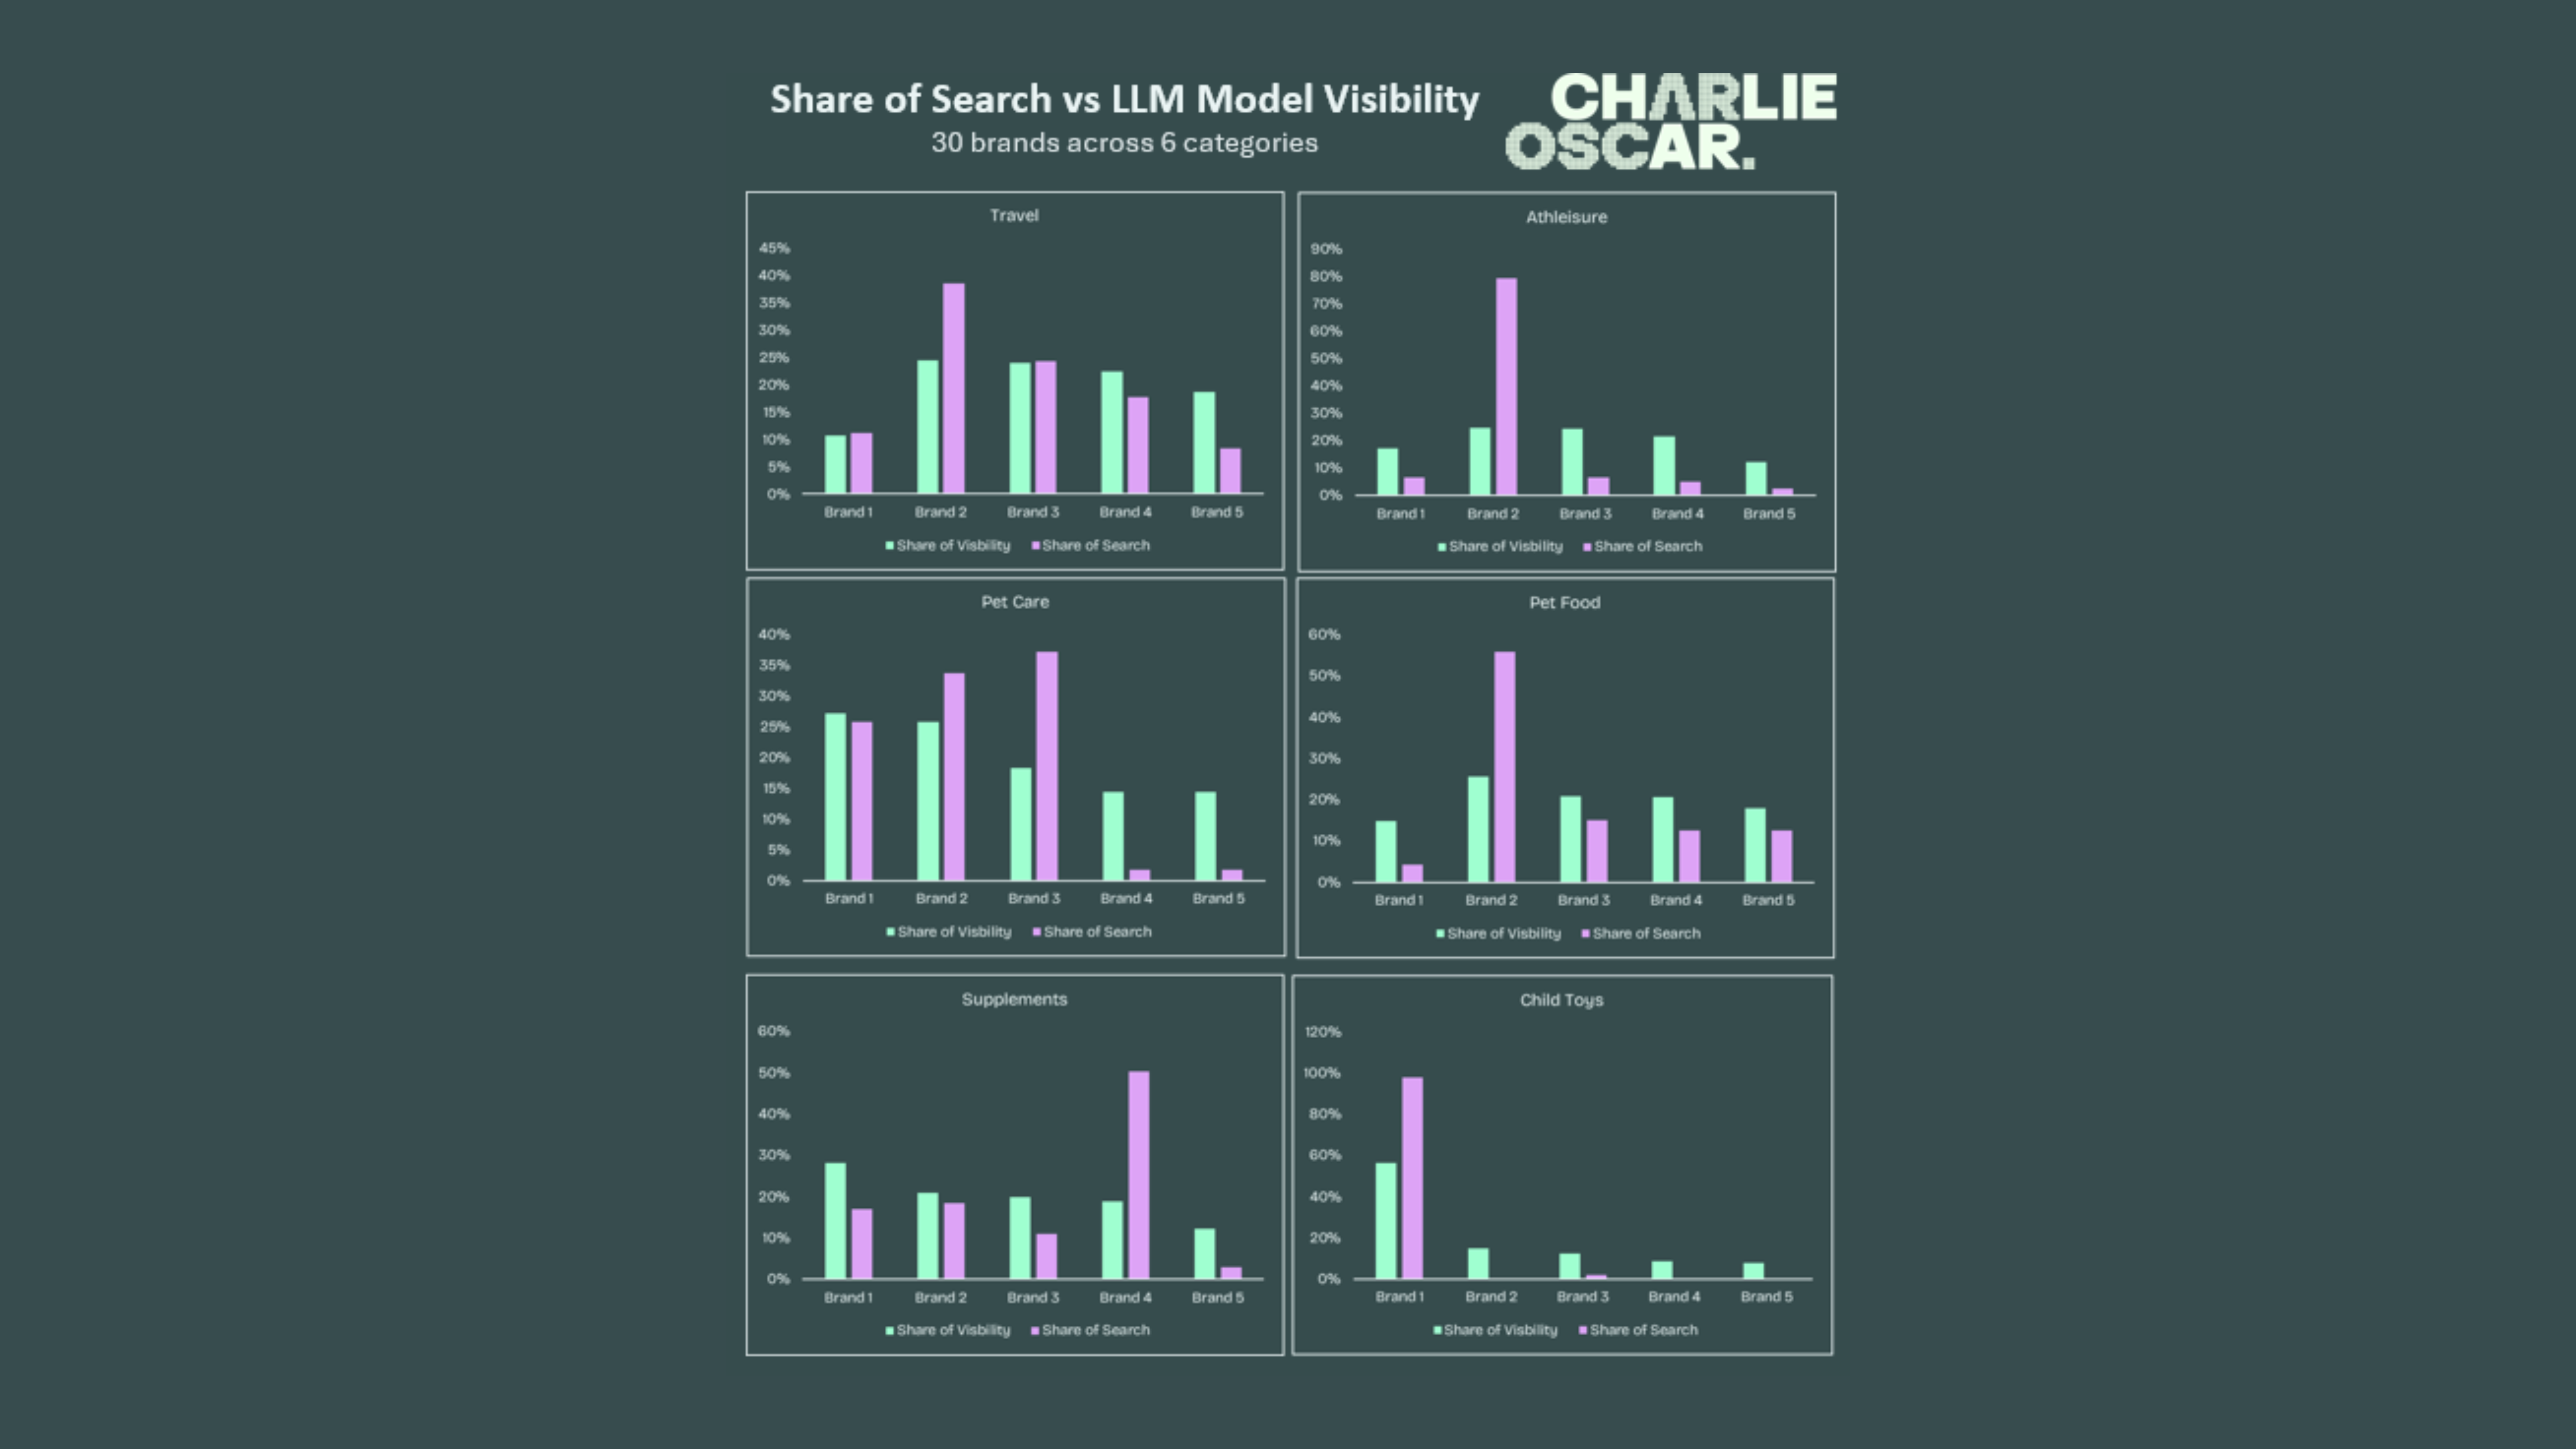
Broadly, both the search engines and the LLMs agree on who the biggest brand is. They agree on who is recommended the most and who is most searched by customers.
But while Google search volume is dominated by the biggest players, the LLM visibility results are more varied. The biggest brand still gets the biggest share of the pie. But the whole pie is shared more widely.
A large part of this is the nature of conversational responses. If you ask for a recommendation for running shoes, ChatGPT will typically recommend three options.
Even if there is a clear market leader (like in the Child Toys graph above), LLMs will still mention smaller brands. Even if the search volumes show us a brand with more than 90% share of search volume.
There is a bigger opportunity for newer, smaller brands to compete in the LLM space.
Do brands grow and shrink on both metrics at the same time?
When we compare the two metrics over time, there is some broad agreement. But it isn’t a close correlation.
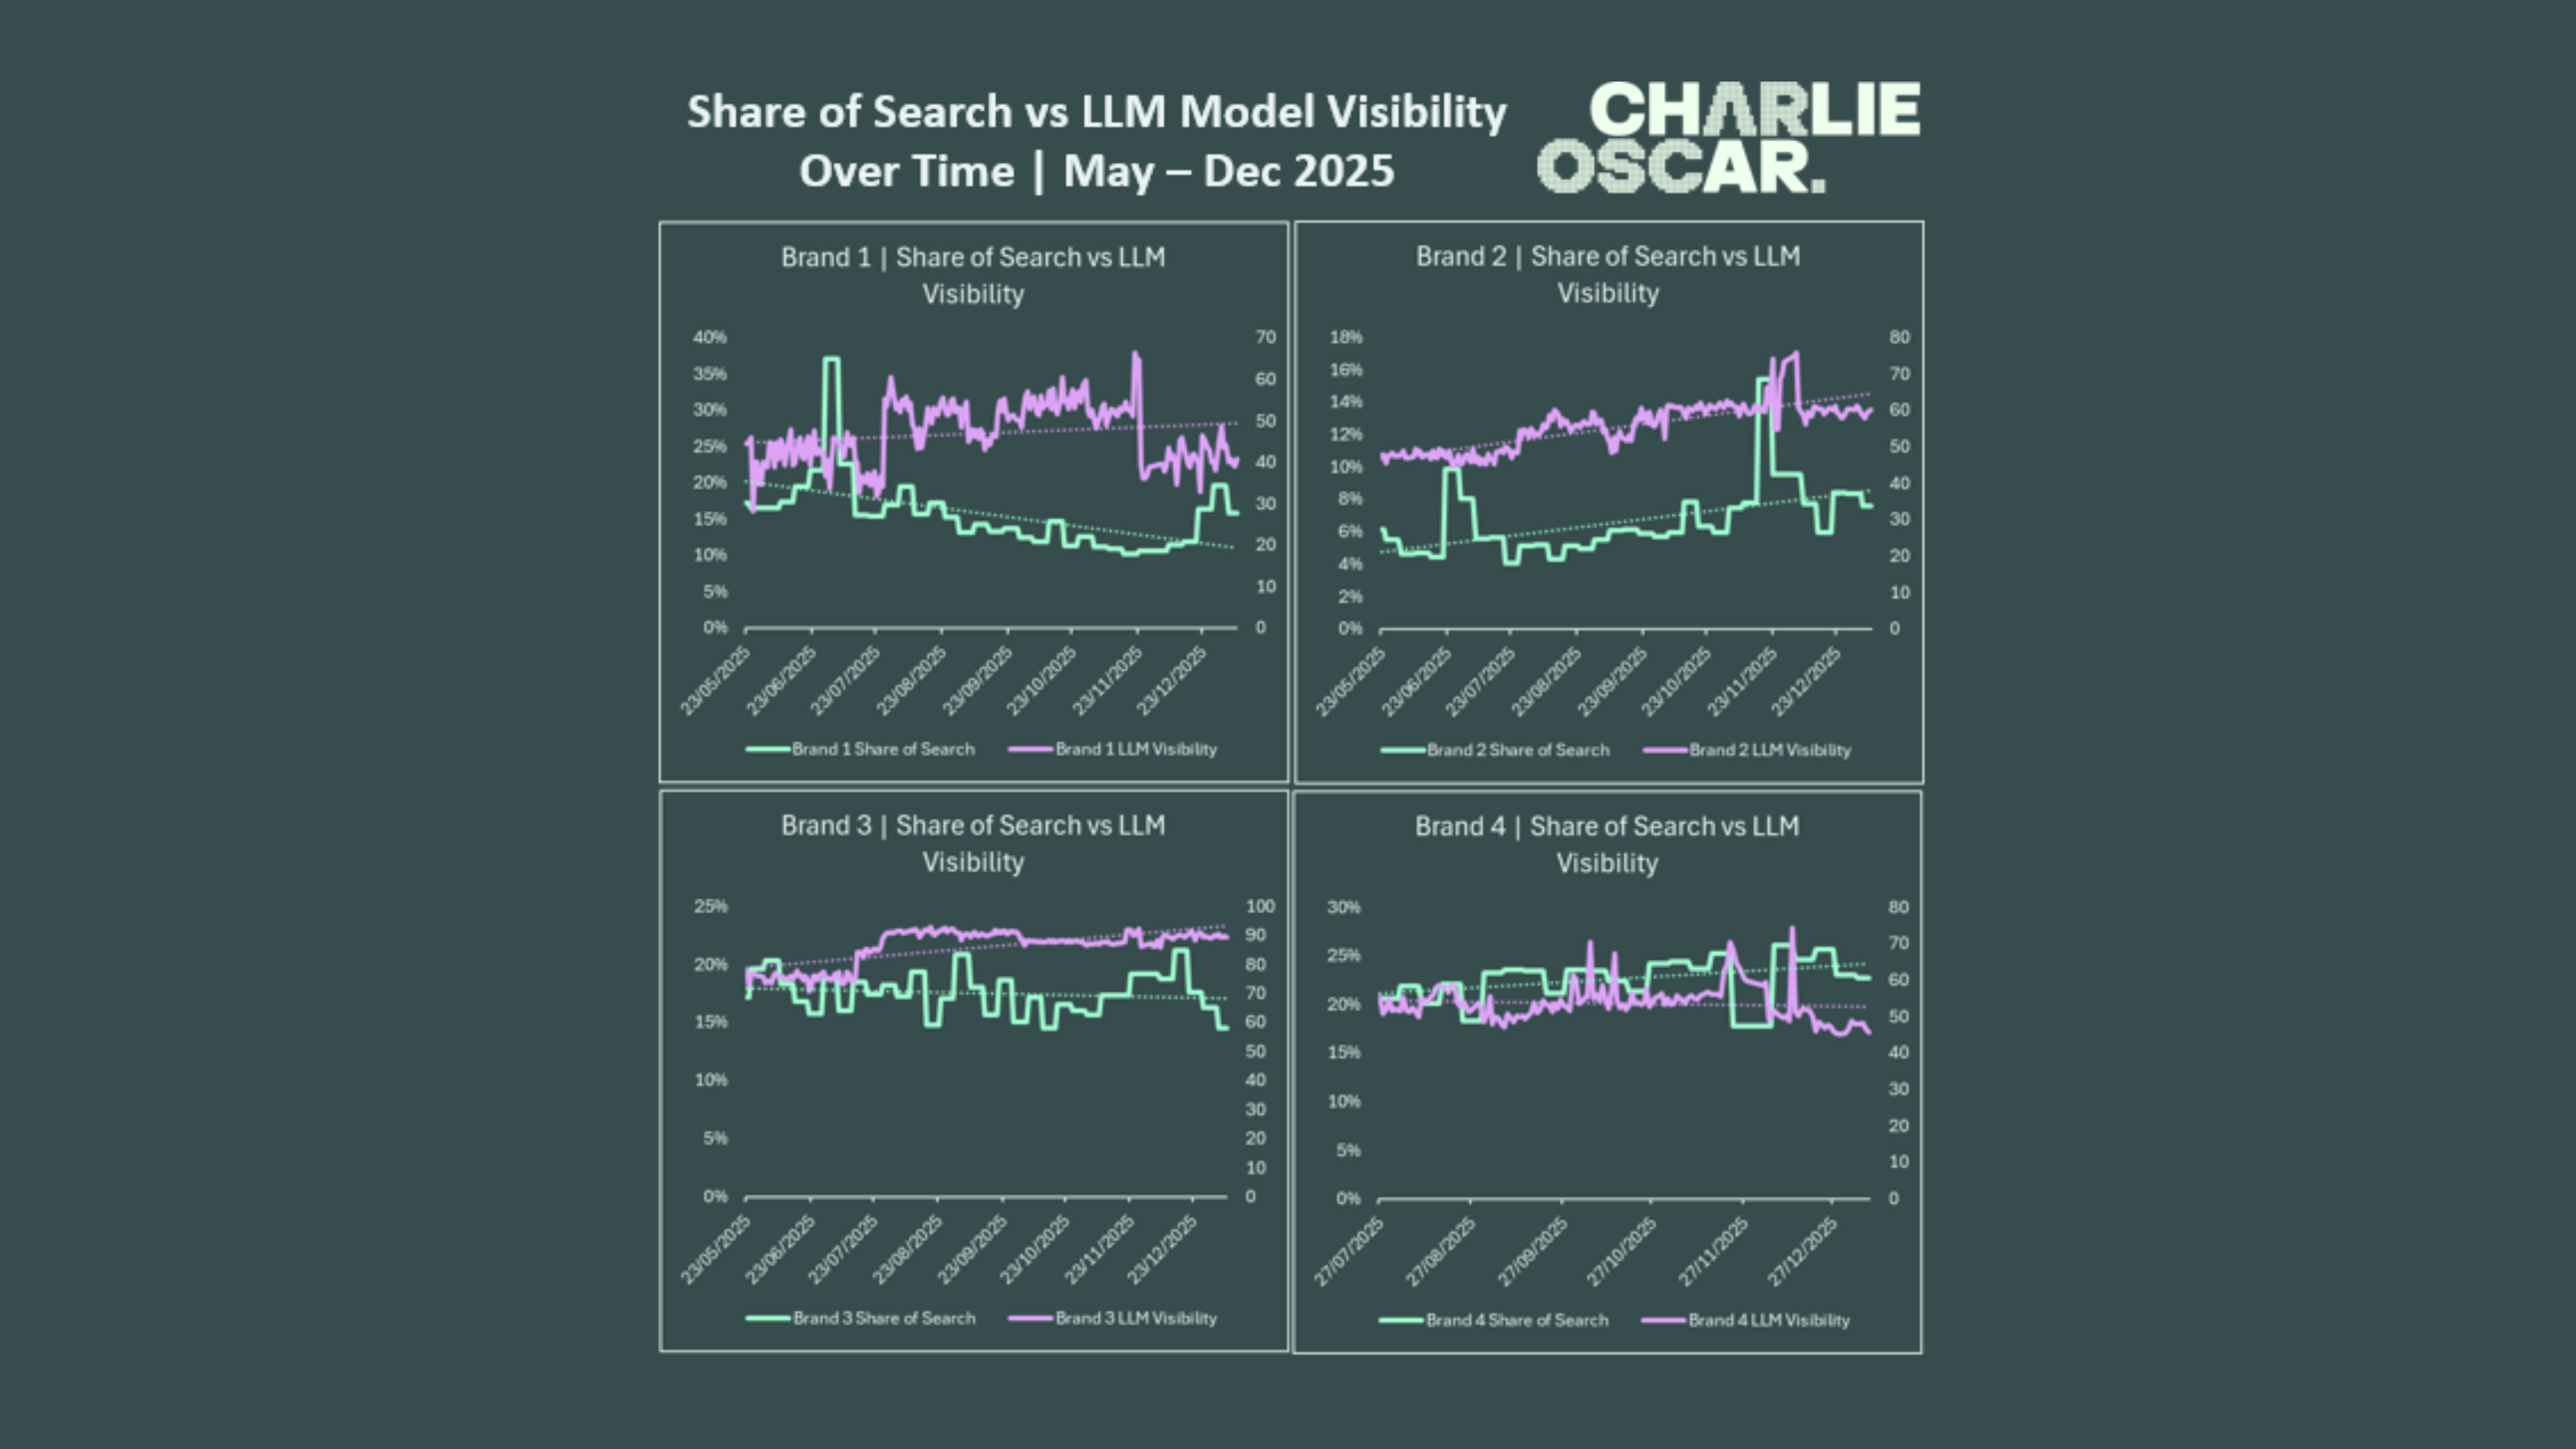
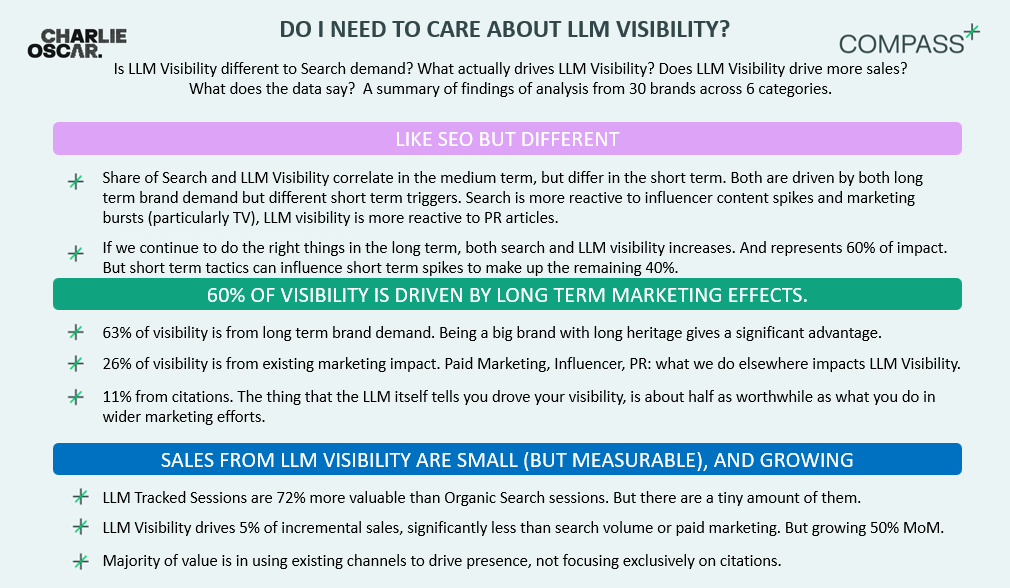
Generally speaking, as share of search increases, LLM visibility also increases. And vice versa. It is truer over the medium term. The short-term correlation is very weak.
This suggests the key long-term driver of both is shared underlying brand equity and brand growth. Good old fashioned marketing outcomes, impacting some of the most recent marketing platforms.
But the short-term trigger for spikes and troughs is very different.
Digging into some of these short-term spikes:
Share of search is much more reactive to PR and influencer content spikes, along with increased marketing spend (particularly short-term TV bursts).
LLM visibility gains spikes from PR articles and some shift changes which appear to be impacts of model updates.
If you do the right things in the long term, both search and LLM visibility tend to increase. But there are several things you can do in the short term which can cause a spike in one without causing a spike in the other.
2. What actually drives LLM visibility? How much control do we have?
There are a number of tools available which can show you the citations referenced when a brand is mentioned in LLM responses. These skew towards user-generated content. Particularly Q&A content on platforms such as Reddit.
This measures the sources cited by LLMs. These vary over time but lean towards recency and Q&A formats focused specifically on the questions being asked by the user. Probably why they like Reddit, which is brilliant at fast moving conversational content.
But is this the actual driver of LLM visibility?
Anyone who has been around marketing measurement for a while knows the problem with correlation and causality, so let’s try to dig into some of that problem here.
Where these citations are from user-generated content, what caused the user to actually write about the brand? (Some of the content is actually brand-generated but intended to appear user-generated, but that is a problem for another time)
People don’t tend to write about brands they don’t have experiences with. So if the citation references the content, what drove the user to write the content in the first place?
This is our correlation vs causation problem. The content is cited and shows strong correlation to visibility. But was there something in the background driving both of them?
We can run models to understand the underlying driver of the change in visibility. We want to see how much we can understand the original driver rather than the citation linked in the response.
Regression models allow us to understand which external factors are most correlated with changes in LLM visibility.
By lagging all the independent variables, we can infer that this correlation is more likely to be causal. Because it is hard for today’s visibility to be driven by something which happens next week, but it can be driven by something which happened last week.
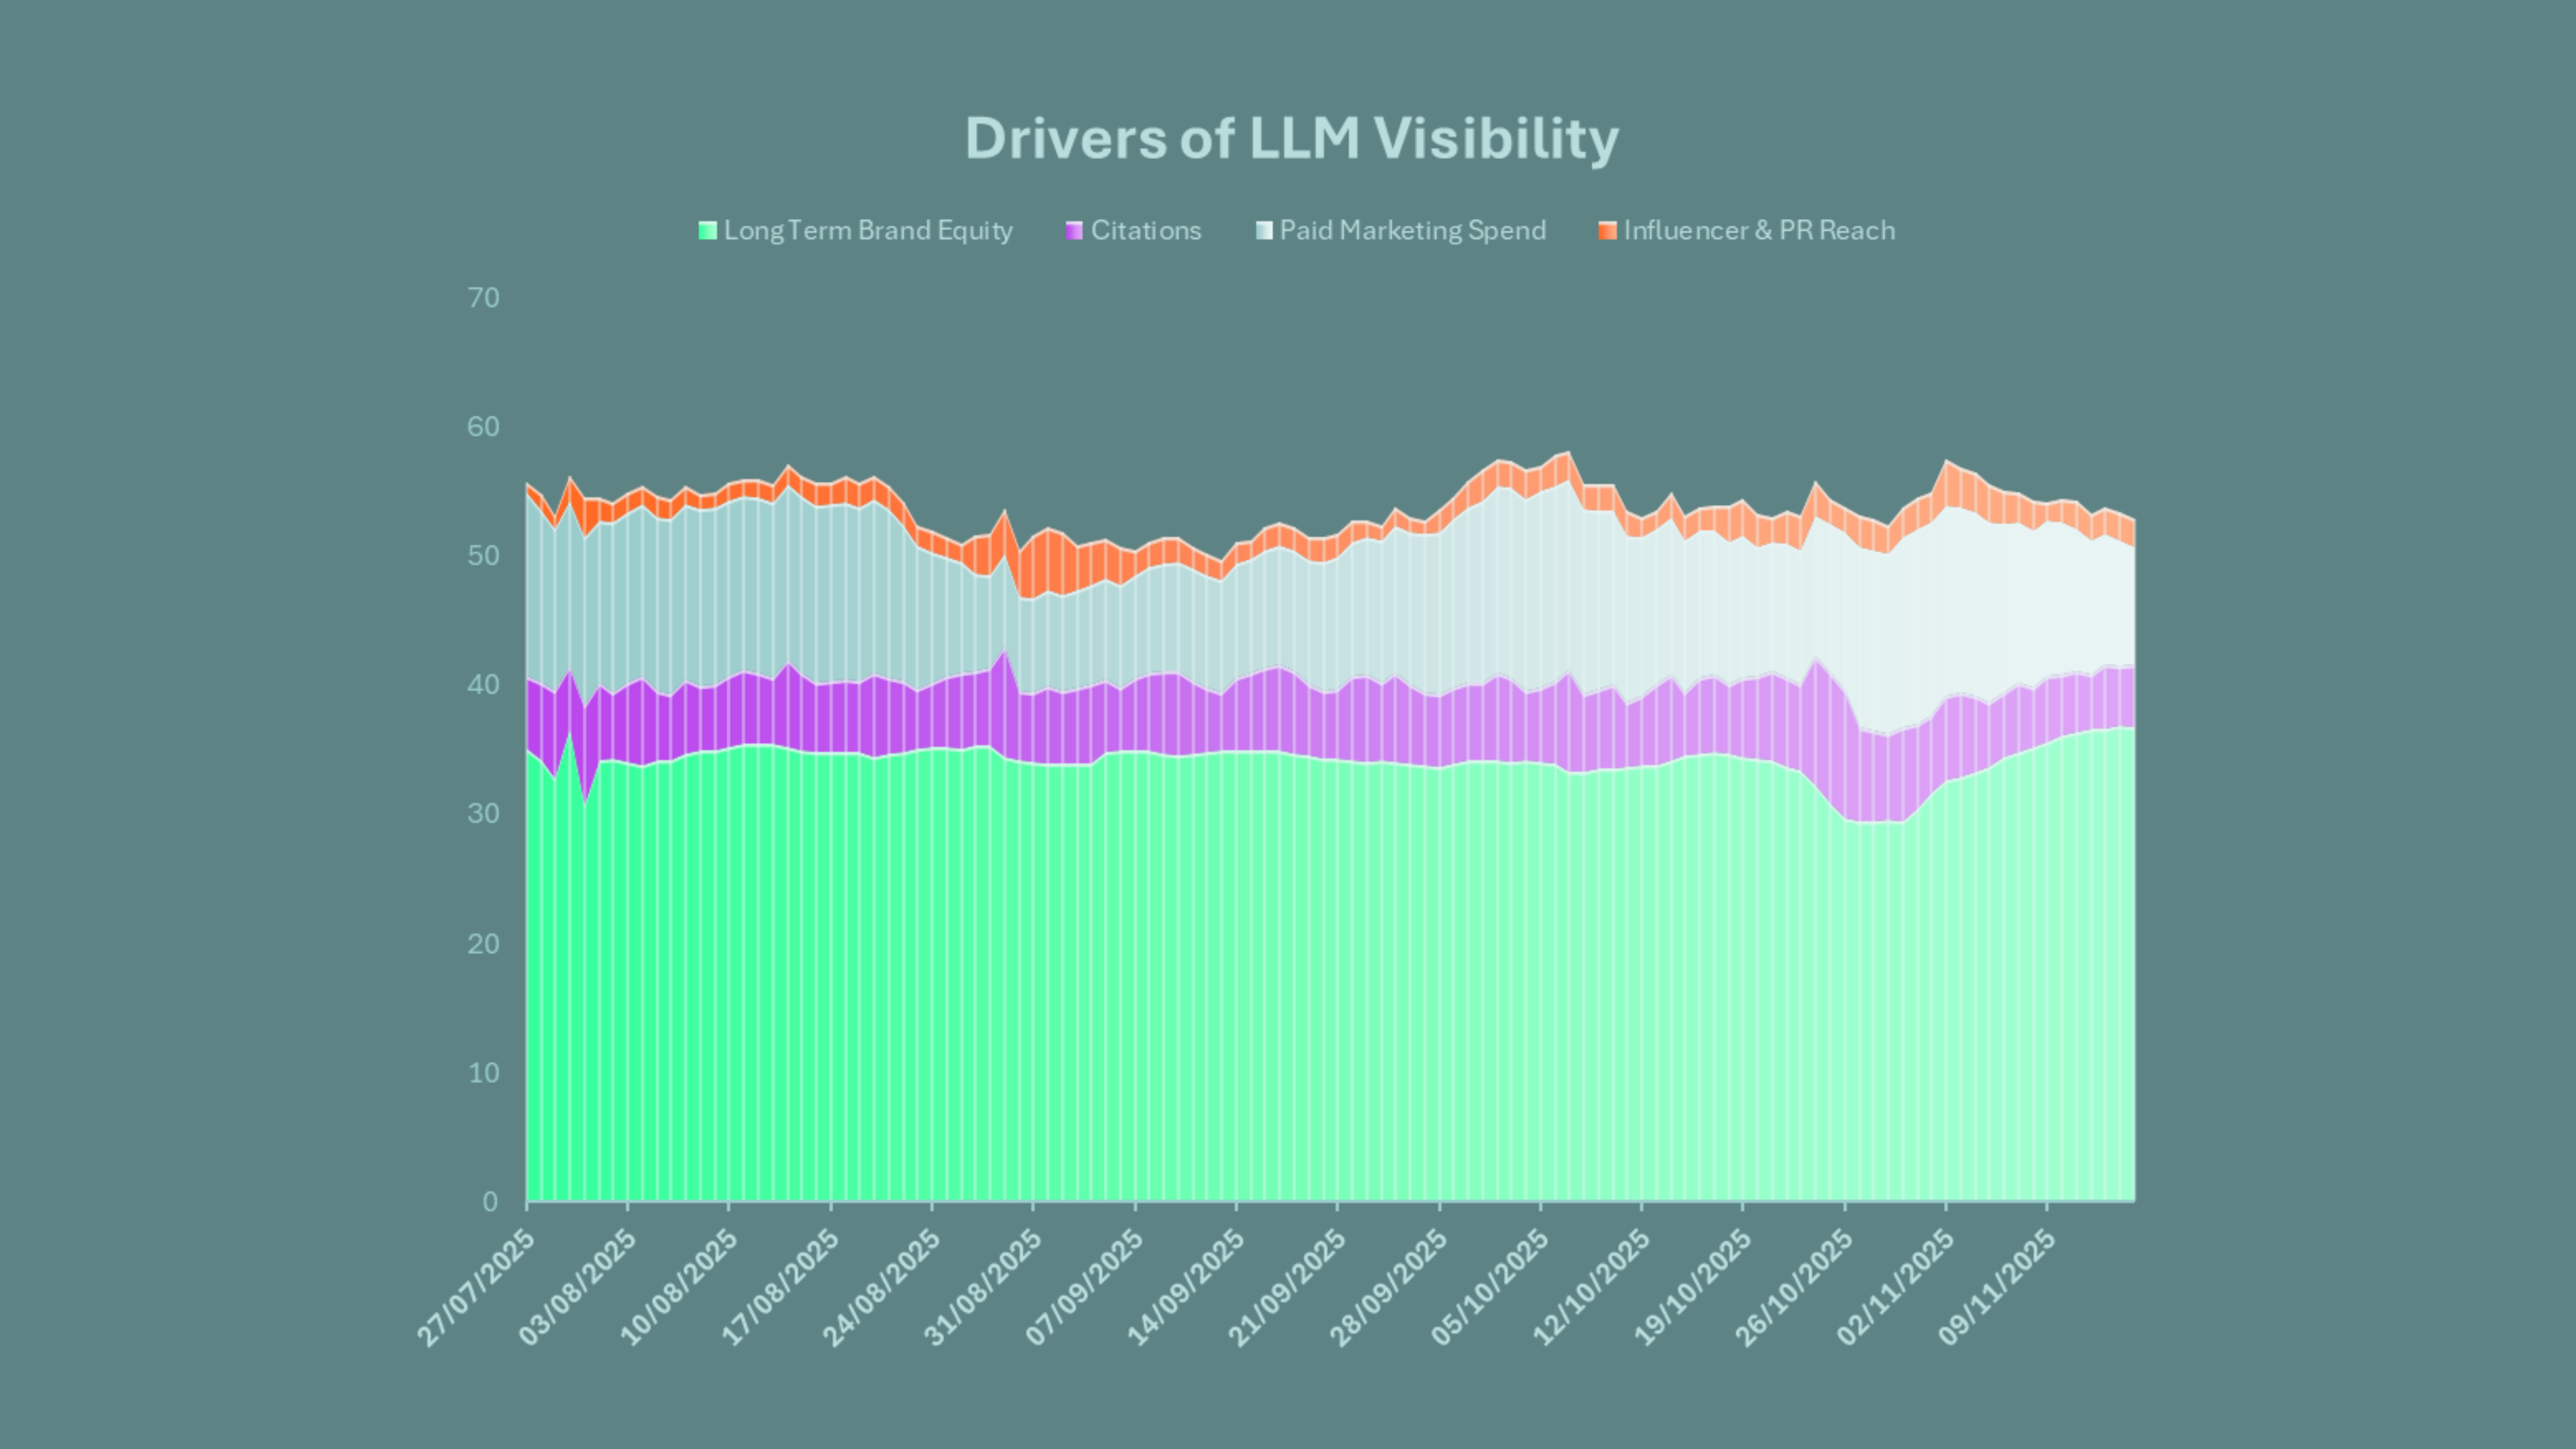
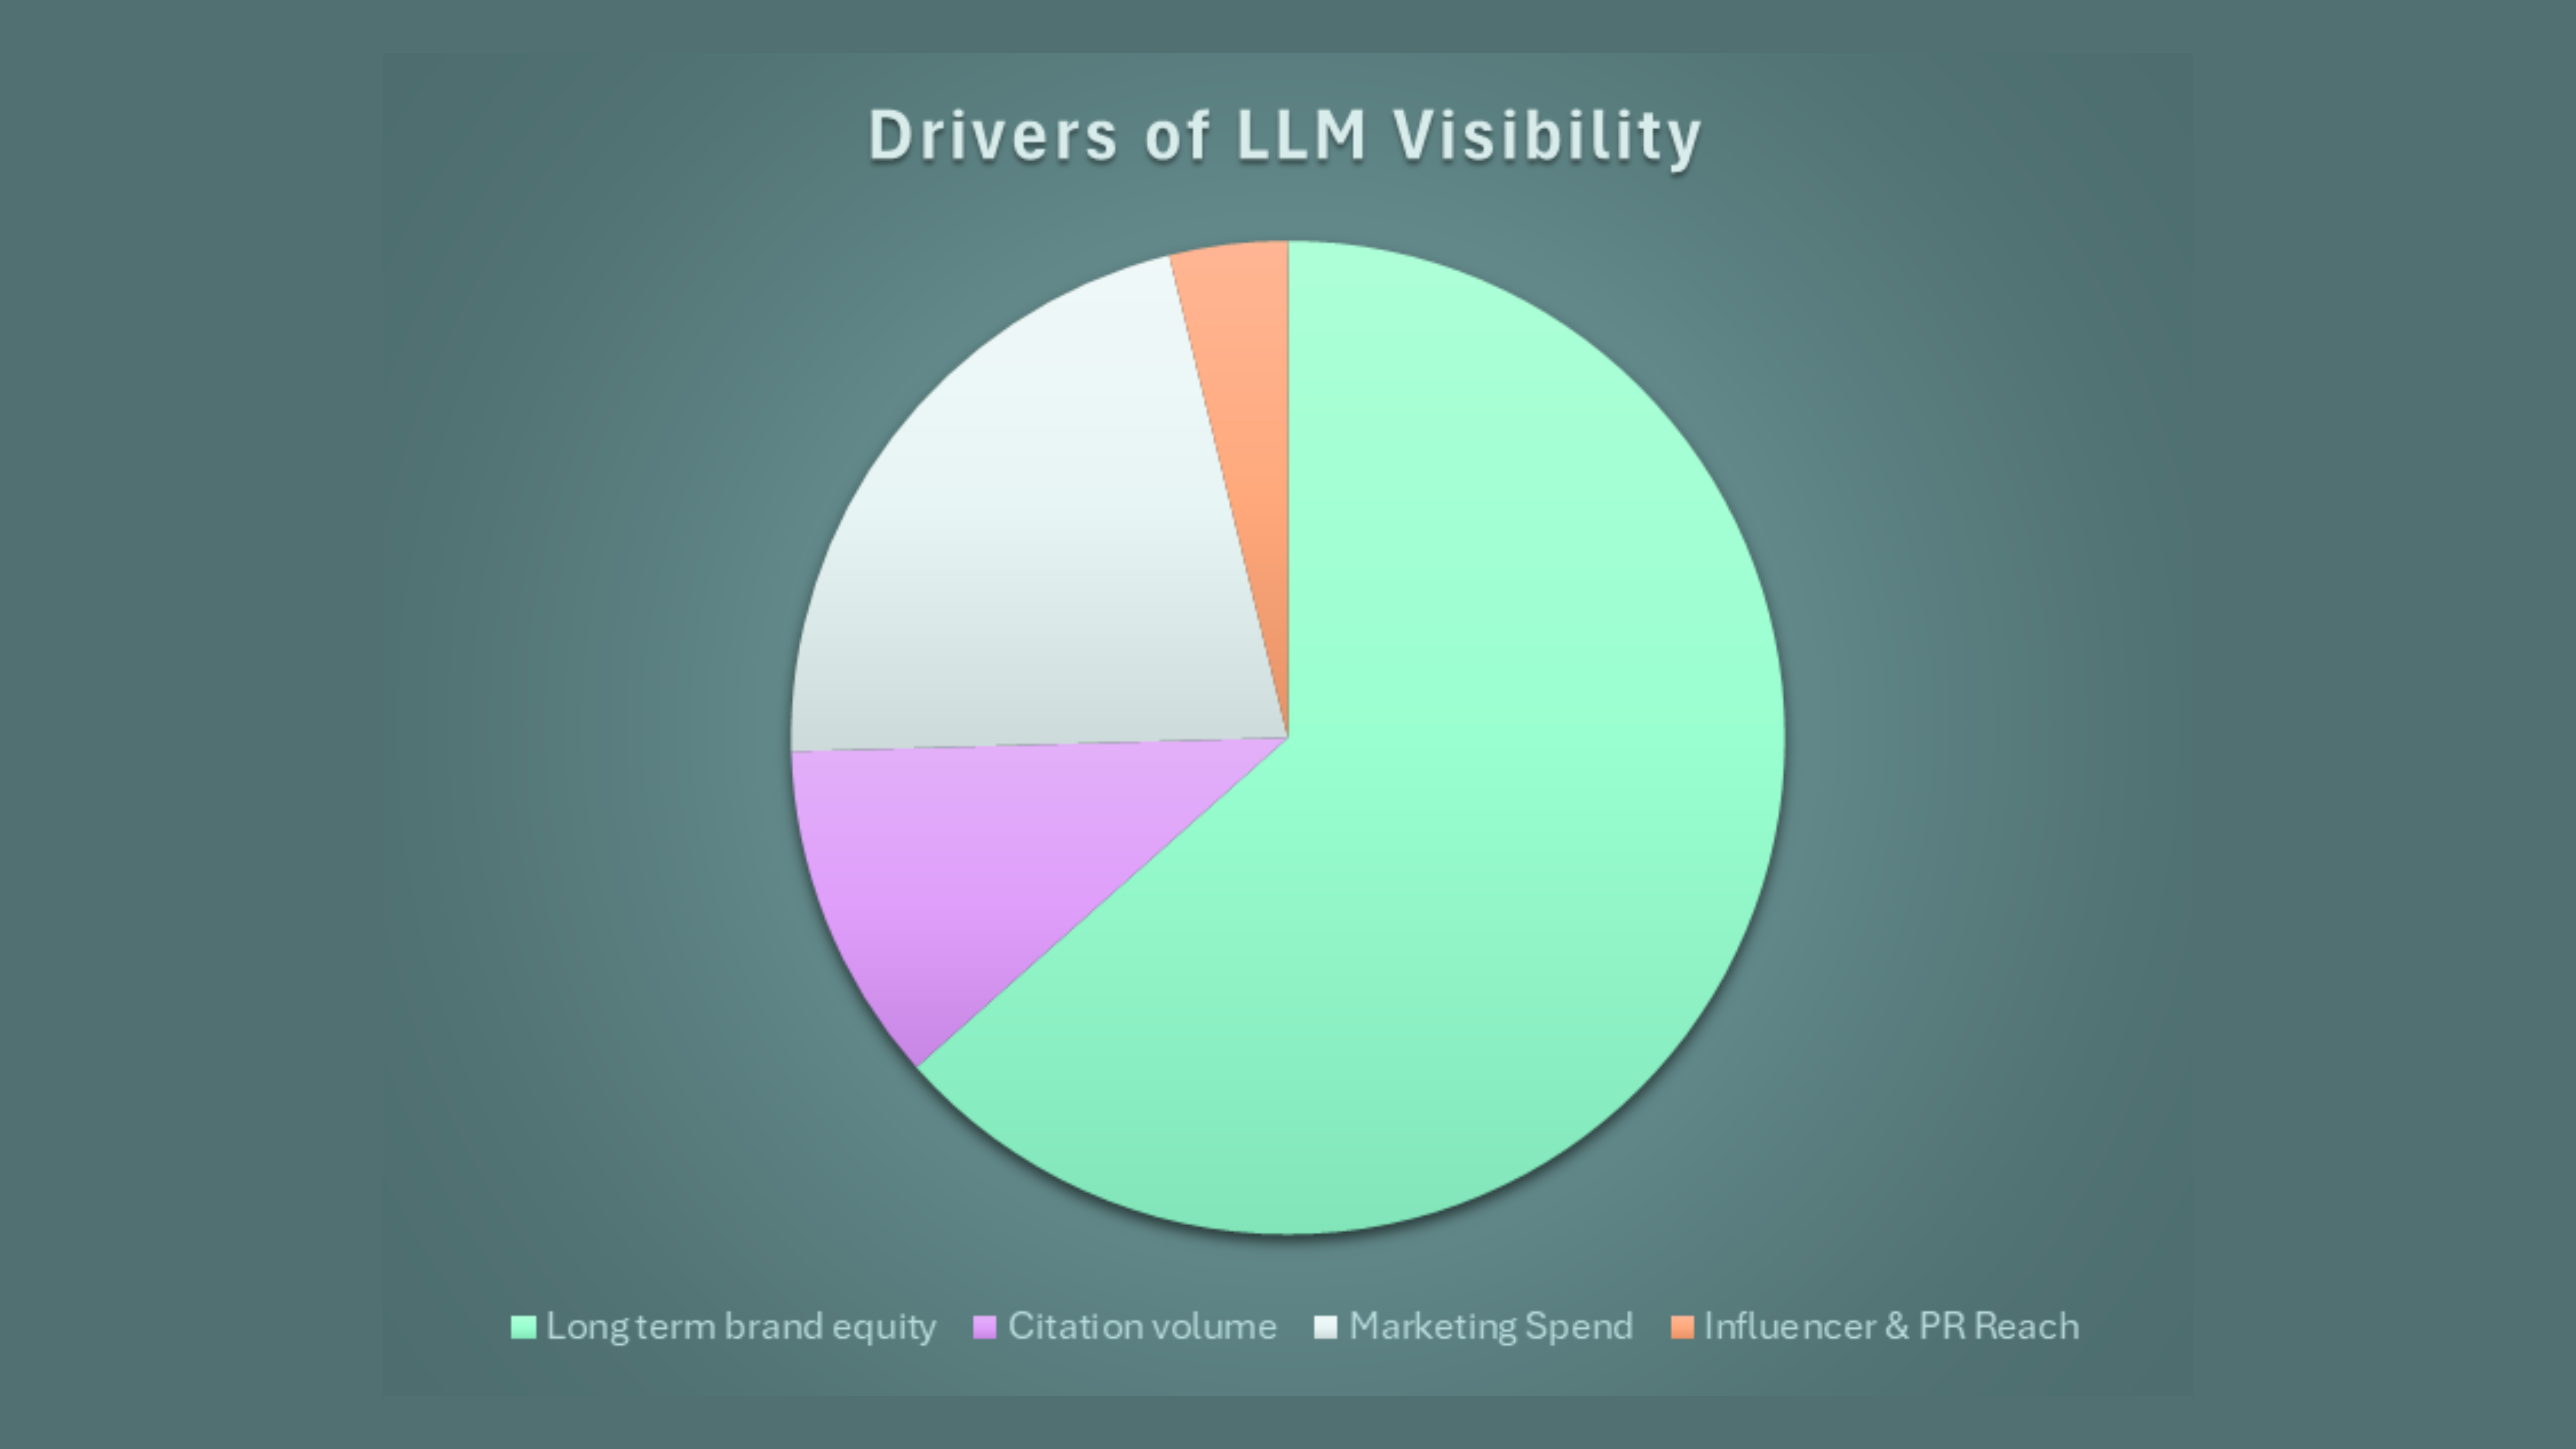
This gives a strong baseline visibility driven by long-term brand equity. It represents 63% of total LLM visibility. That seems sensible, big brands have strong long term brand equity and tonnes of content speaking about them, and the LLM responses will see loads of signals for that and reflect it in how often they recommend them.
But we have 37% of visibility impacted by levers we can more directly control through marketing:
- 11% from Citation volume: With a skew towards recent citations and high-impact citations (e.g. Reddit, review websites). When we get more, and better, presence our LLM visibility improves.This is after we remove the longer term equity and just focus on incremental citations in the short term.
- 22% impact from total marketing spend: When we invest more in marketing, we grow underlying brand presence. And this helps to increase LLM visibility. Again, seems sensible, have a bigger presence and be noticed more, then recommended more.
- 4% from Influencer and PR reach: When we are spoken about elsewhere, our LLM visibility increases. Typically linked to a small volume of key posts in key locations but seems to work in a similar way to citations.
So two-thirds of LLM visibility is based on things we did years ago. It is largely unchanged by things we can do now. Great news for the big brands, less positive for new challengers.
One-third is based on things we do week by week. Month by month. Through channels we can control and impact. This is where the new challengers have more chance to win, and the big brands need to do more to defend their visibility dominance.
AEO is usually focused on citations. But this only represents half of the impact we get from wider marketing activity.
What we do in our wider marketing activity is twice as impactful in LLM visibility than any AEO citation building. Despite being new platforms and new methods, some of the long term marketing fundamentals still drive some of the biggest impact.
Content we generate through influencer marketing and PR can drive as much uplift as citation impacts during key content peaks. But it has a less consistent impact on the brands we have modelled.
Let’s go to our third question.
We now know LLM visibility is similar but different to search demand.
And we know we have some control over how visible we are. (Though maybe not in a simple “more citations = more visibility” approach). So “should I really care”?
3. Does it actually matter? Does driving stronger discoverability actually drive stronger business performance?
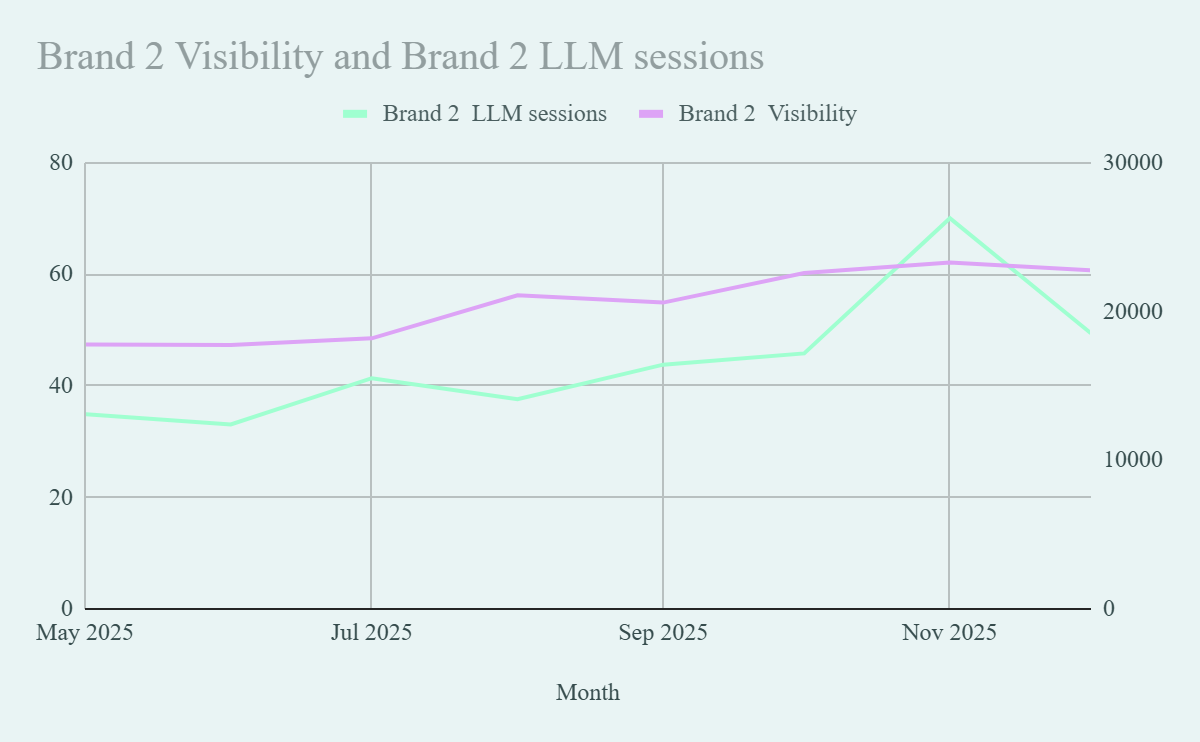
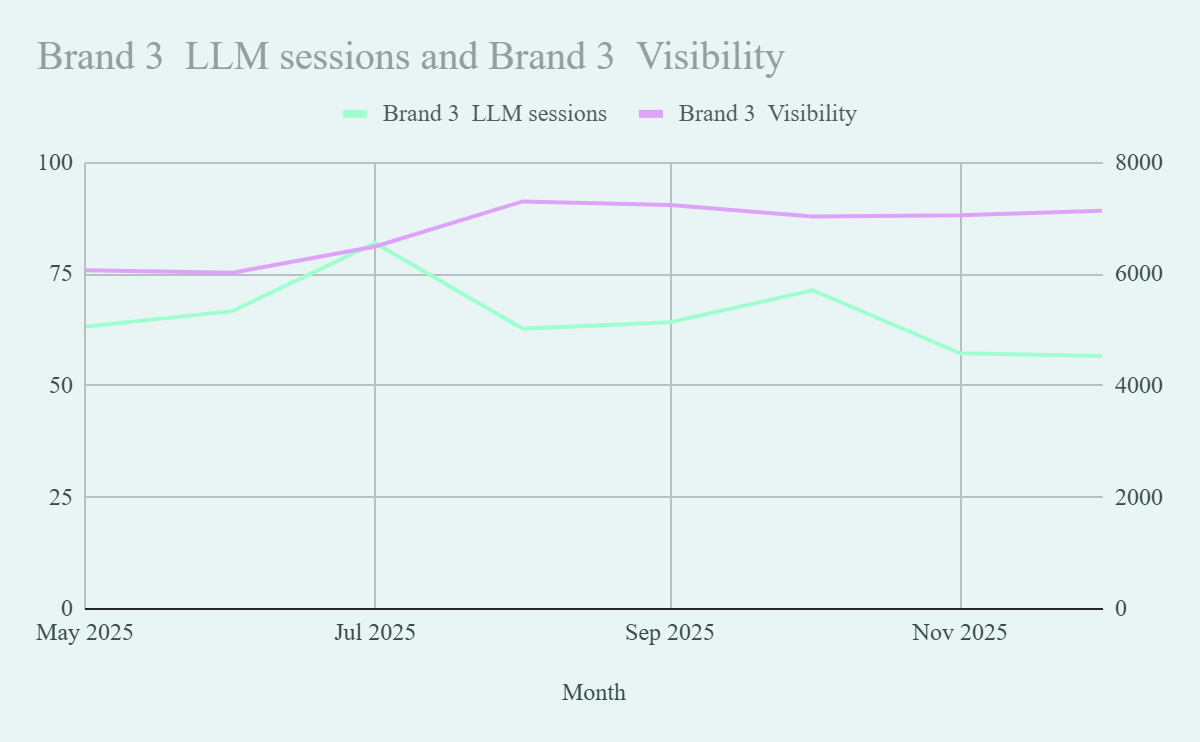
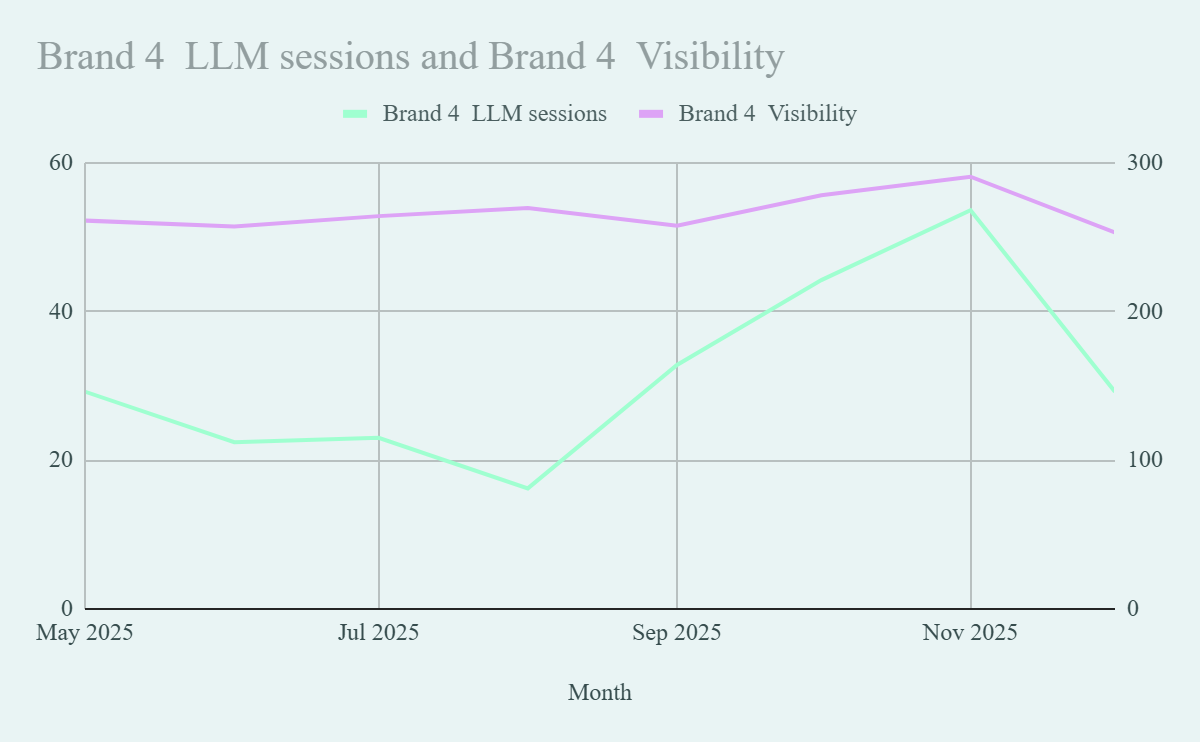
Most brands are seeing increased LLM tracked sessions month on month. (There is some consistency in a drop during August, likely linked to summer holidays). This trend is consistent across the brands in this study.
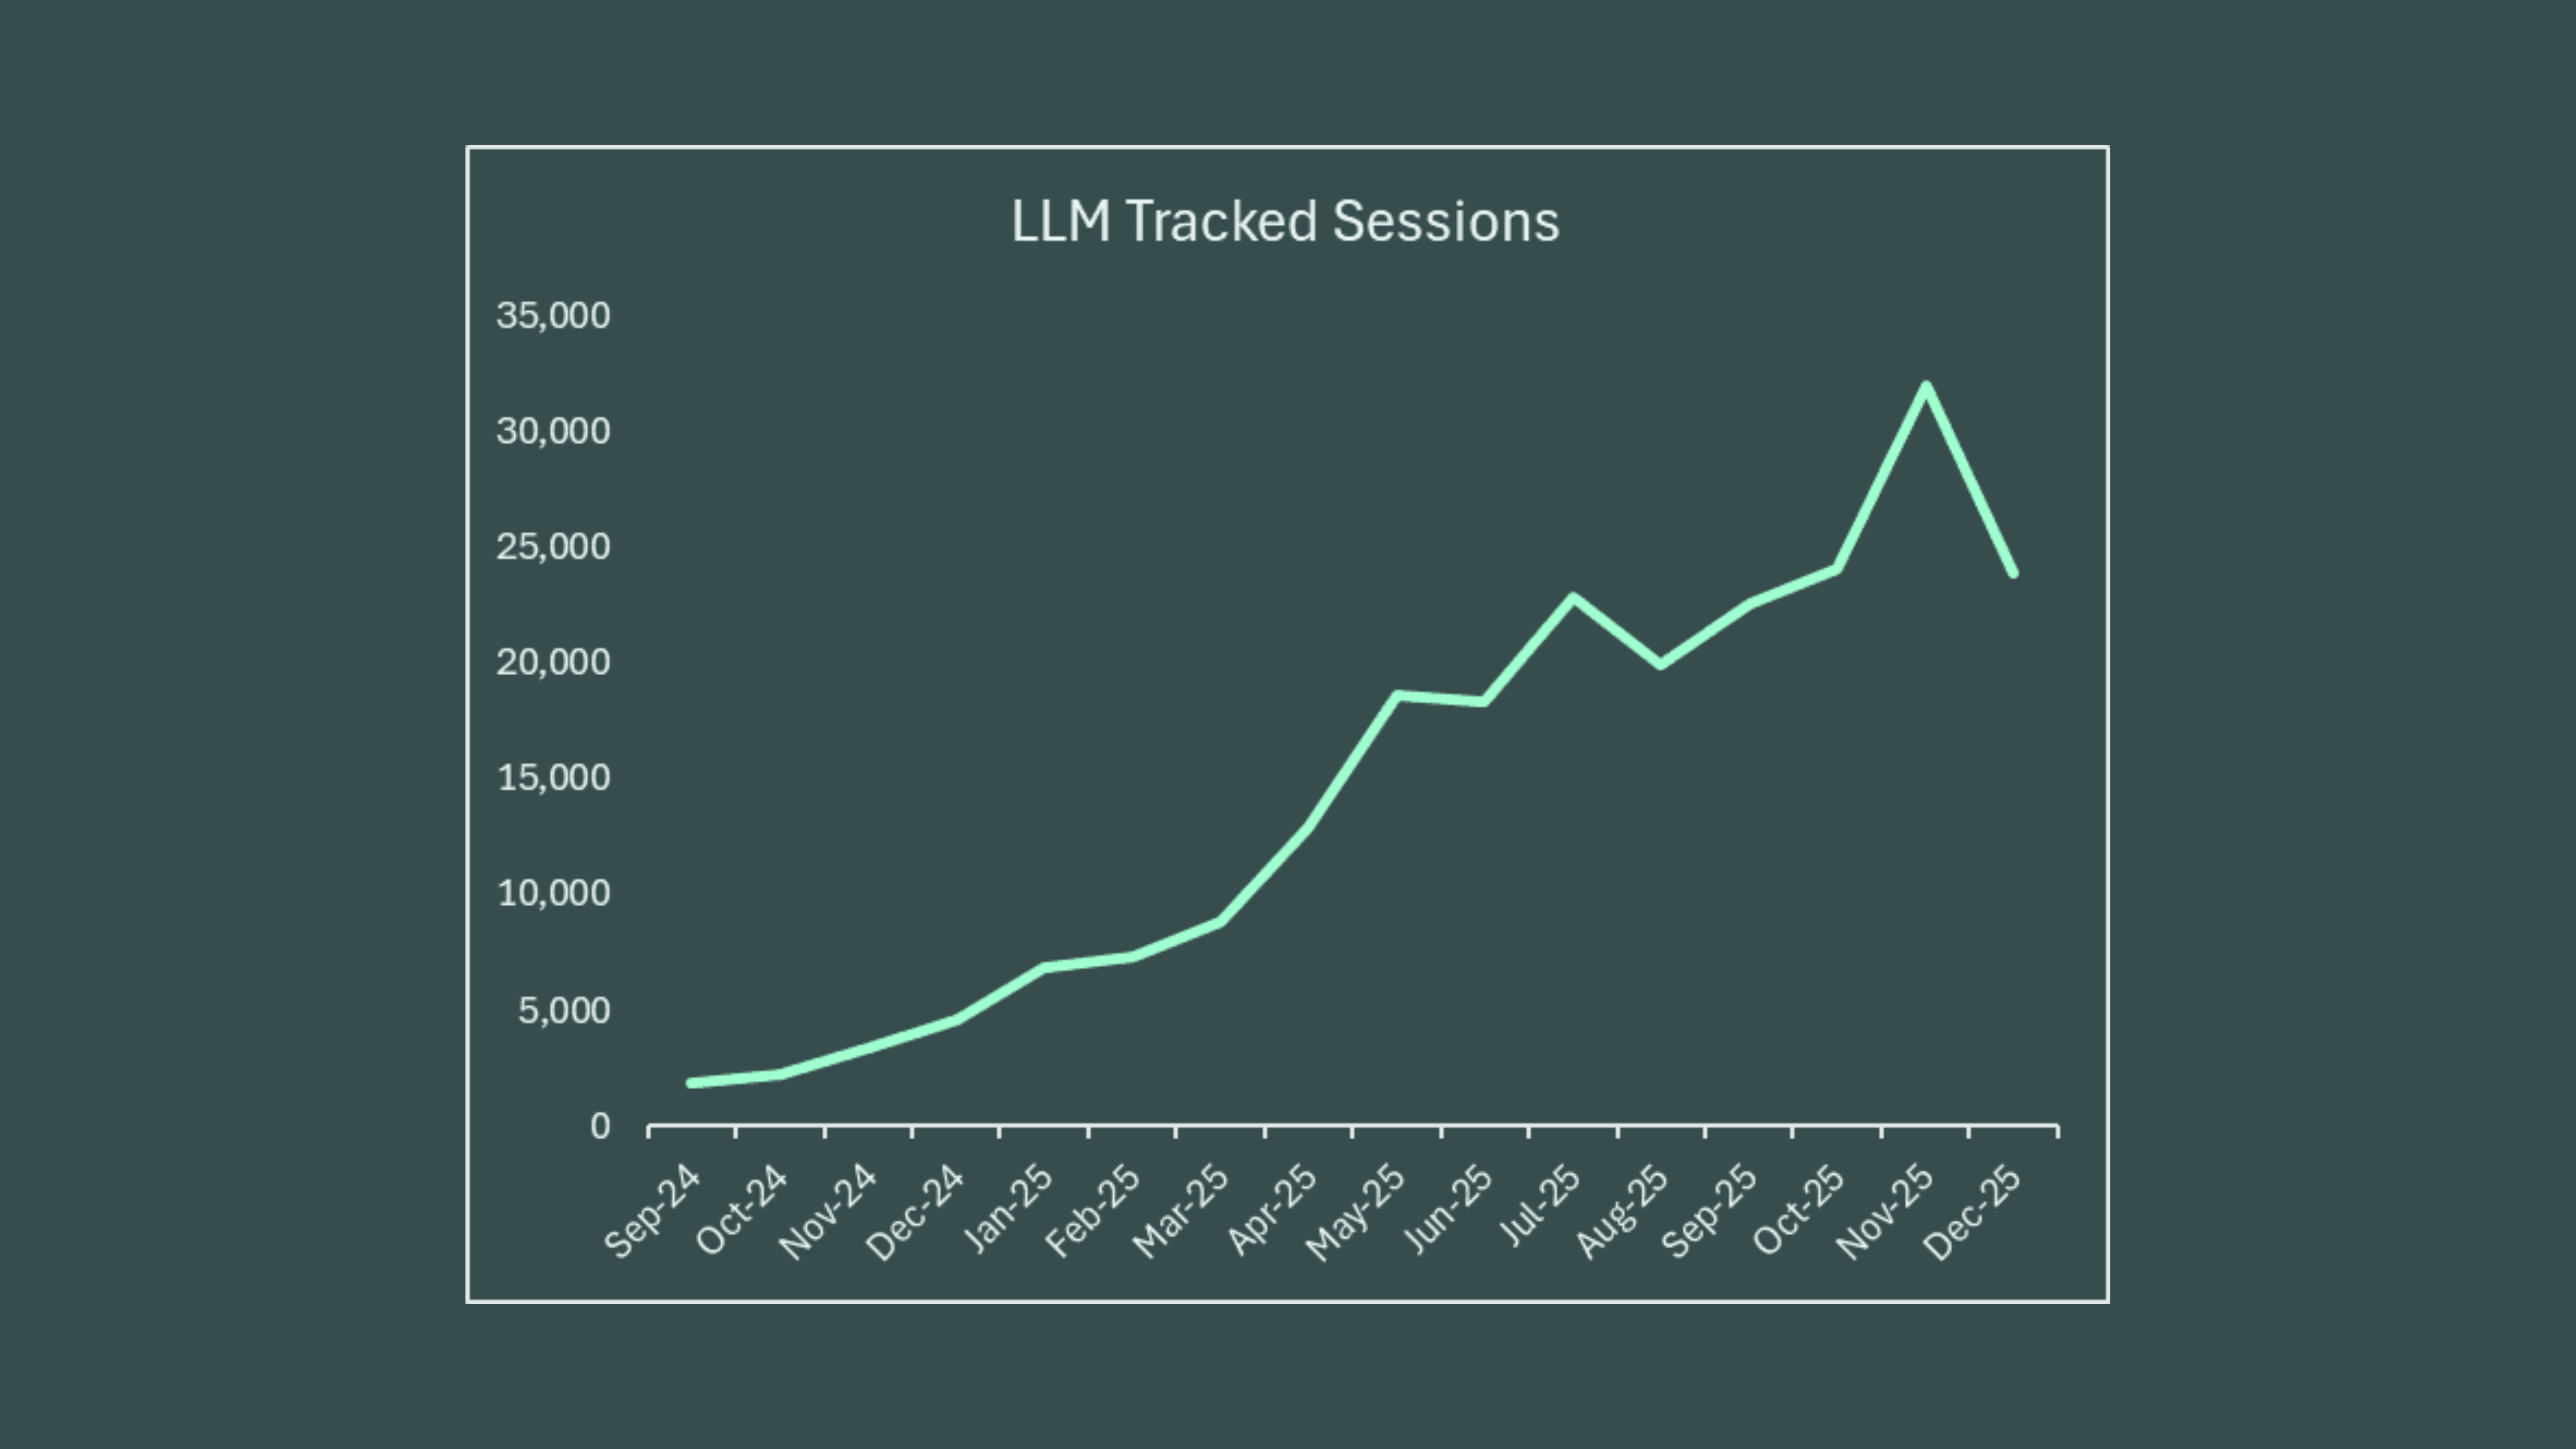
The volumes are quite low, but we know that this is primarily a zero click environment. Most users aren’t using chatGPT as a method to get to a website, they are using chatGPT so that they don’t have to bother going to the website.
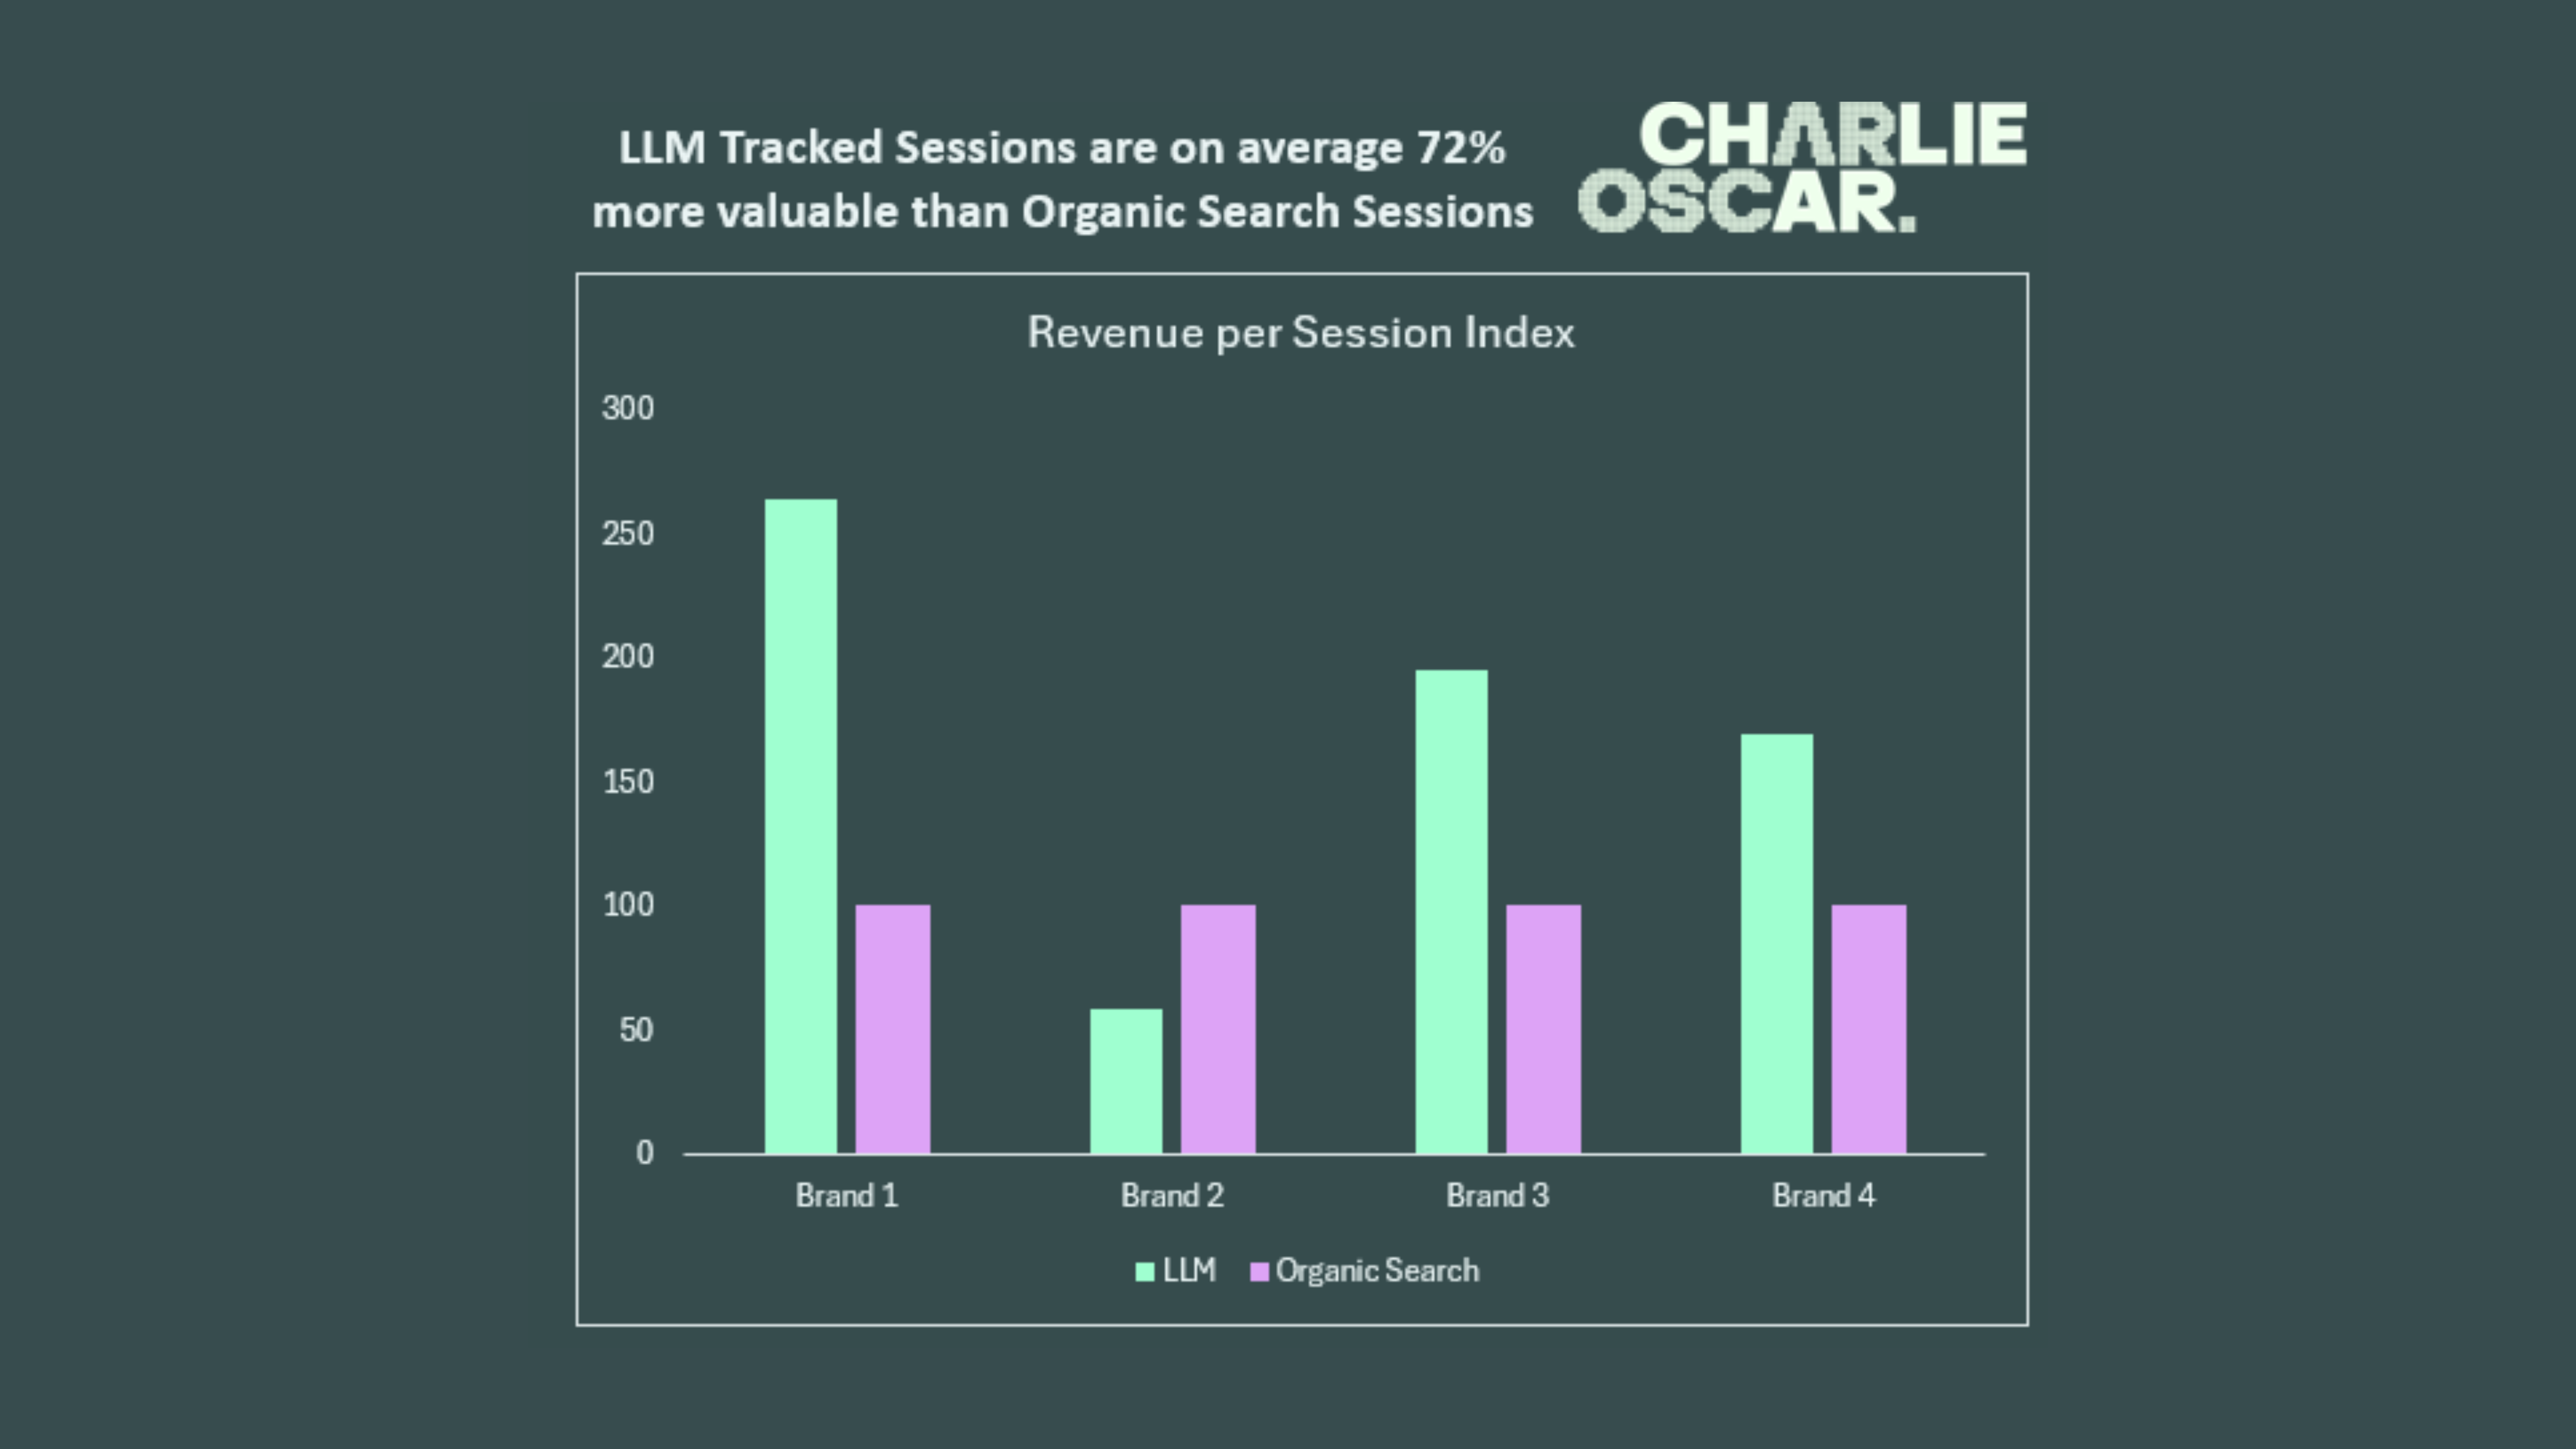
But in general we can see that these LLM tracked sessions are valuable.
In 3 out of 4 cases, LLM tracked sessions are more valuable (higher revenue per session) than Organic Search tracked sessions. (For Brand 2, LLM sessions are less valuable than Organic Search sessions but remain more valuable than paid marketing tracked sessions). In most cases the tracked sessions are more than twice as valuable as their Organic Search equivalents.
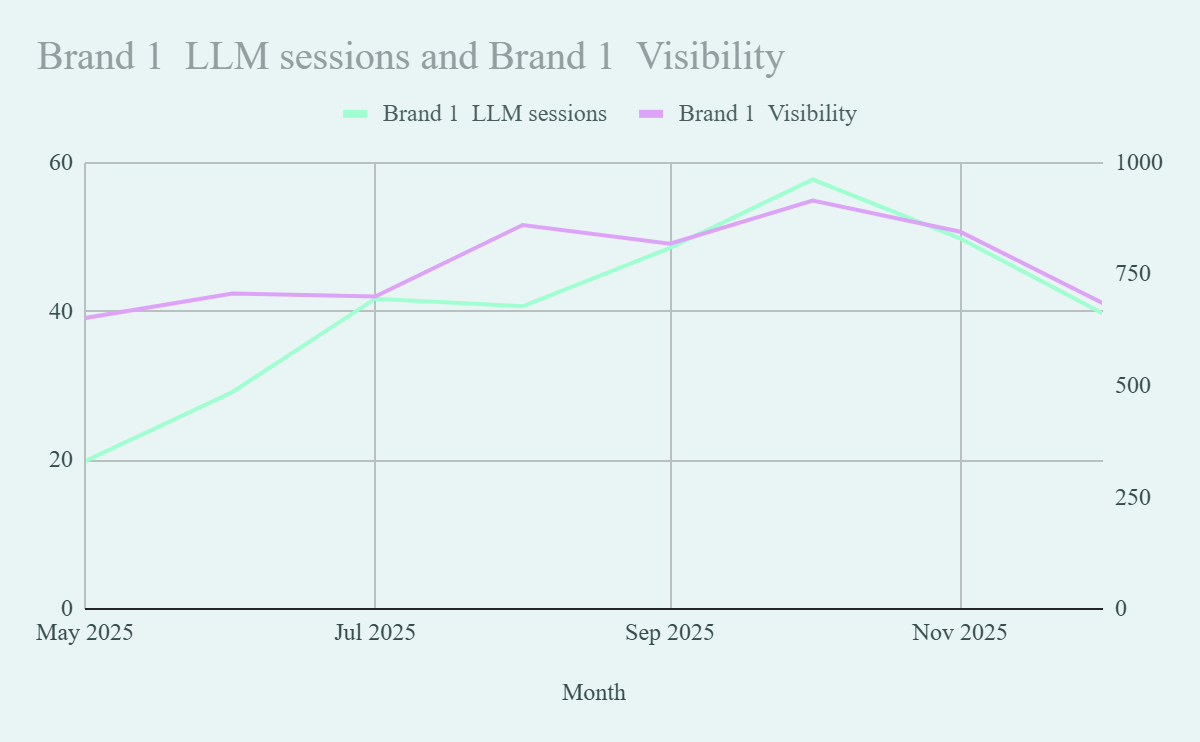
And we can see there is some relationship between visibility and LLM tracked sessions. (Albeit with a lot of external impact. Average correlation across 4 brands is 76%). Makes sense, be more visible in the recommendations and we get more users click through to the site to purchase.
We know higher visibility does drive more tracked sessions. And we know tracked sessions are valuable.
But given that 63% of visibility is from long-term brand demand (as we learnt in the last section), what is the net impact of increased visibility? And what is the net payback on the parts we can control?
We need to calculate that next.
The first thing we should all notice is that the visibility doesn’t really change much. There are some upward and downward trends, and some short sharp spikes, but generally visibility is quite stable across these 6 months we are analysing.
That shouldn’t surprise anyone, after all we know 63% of visibility is from our long term brand demand. That isn’t going to change massively month by month. (I intentionally picked some bigger brands which makes this variation a bit smaller. There are cases of small brands going from zero visibility to high visibility overnight, and these can have a big impact on business performance.)
Max variation (max value / average value) in Share of Search is 78%, max variation in LLM visibility is 45%.
Or if you prefer, standard deviation as a percentage of average is 32% in Share of Search and 11% in LLM visibility.
So the LLM visibility is less spiky in general.
Again, this makes sense. We saw earlier that the search data is much more reactive to short term changes in marketing spend.
So that tells us that we shouldn’t expect a huge impact of LLM visibility on overall business performance.
LLM tracked sessions are less than 1% of total tracked sessions, and in general visibility isn’t moving that much.
We can also run some regression models to help us see the impact of LLM visibility and Search volume on sales after accounting for things like paid marketing, seasonality, competitors.
Regression outputs can help us see the underlying impact of both branded search volume and LLM visibility (modelled as both daily visibility, and weighted visibility which accounts for both ChatGPT usage over time and category demand over time).
(Caveat, this is a short date range of data for regression models, and some of the metrics don’t move a lot. So these outputs have quite wide error margins, but it gives us some directional steer on a topic that doesn’t have a lot of measurement.)
We see a positive impact of LLM presence, as visibility grows, sales grow. Which is reassuring!
It is small (and quite inconsistent across the 6 categories I analysed). But it is there, on the example below (high consideration travel brand) the orange bar at the top is significant and it is growing.
It is larger than the 1% of tracked sessions that website analytics shows us, up to 5% of incremental demand in August (a category peak in this category).
But it is still significantly smaller than both the short term impact of paid marketing (29%) or the impact of increased brand searches (20%).
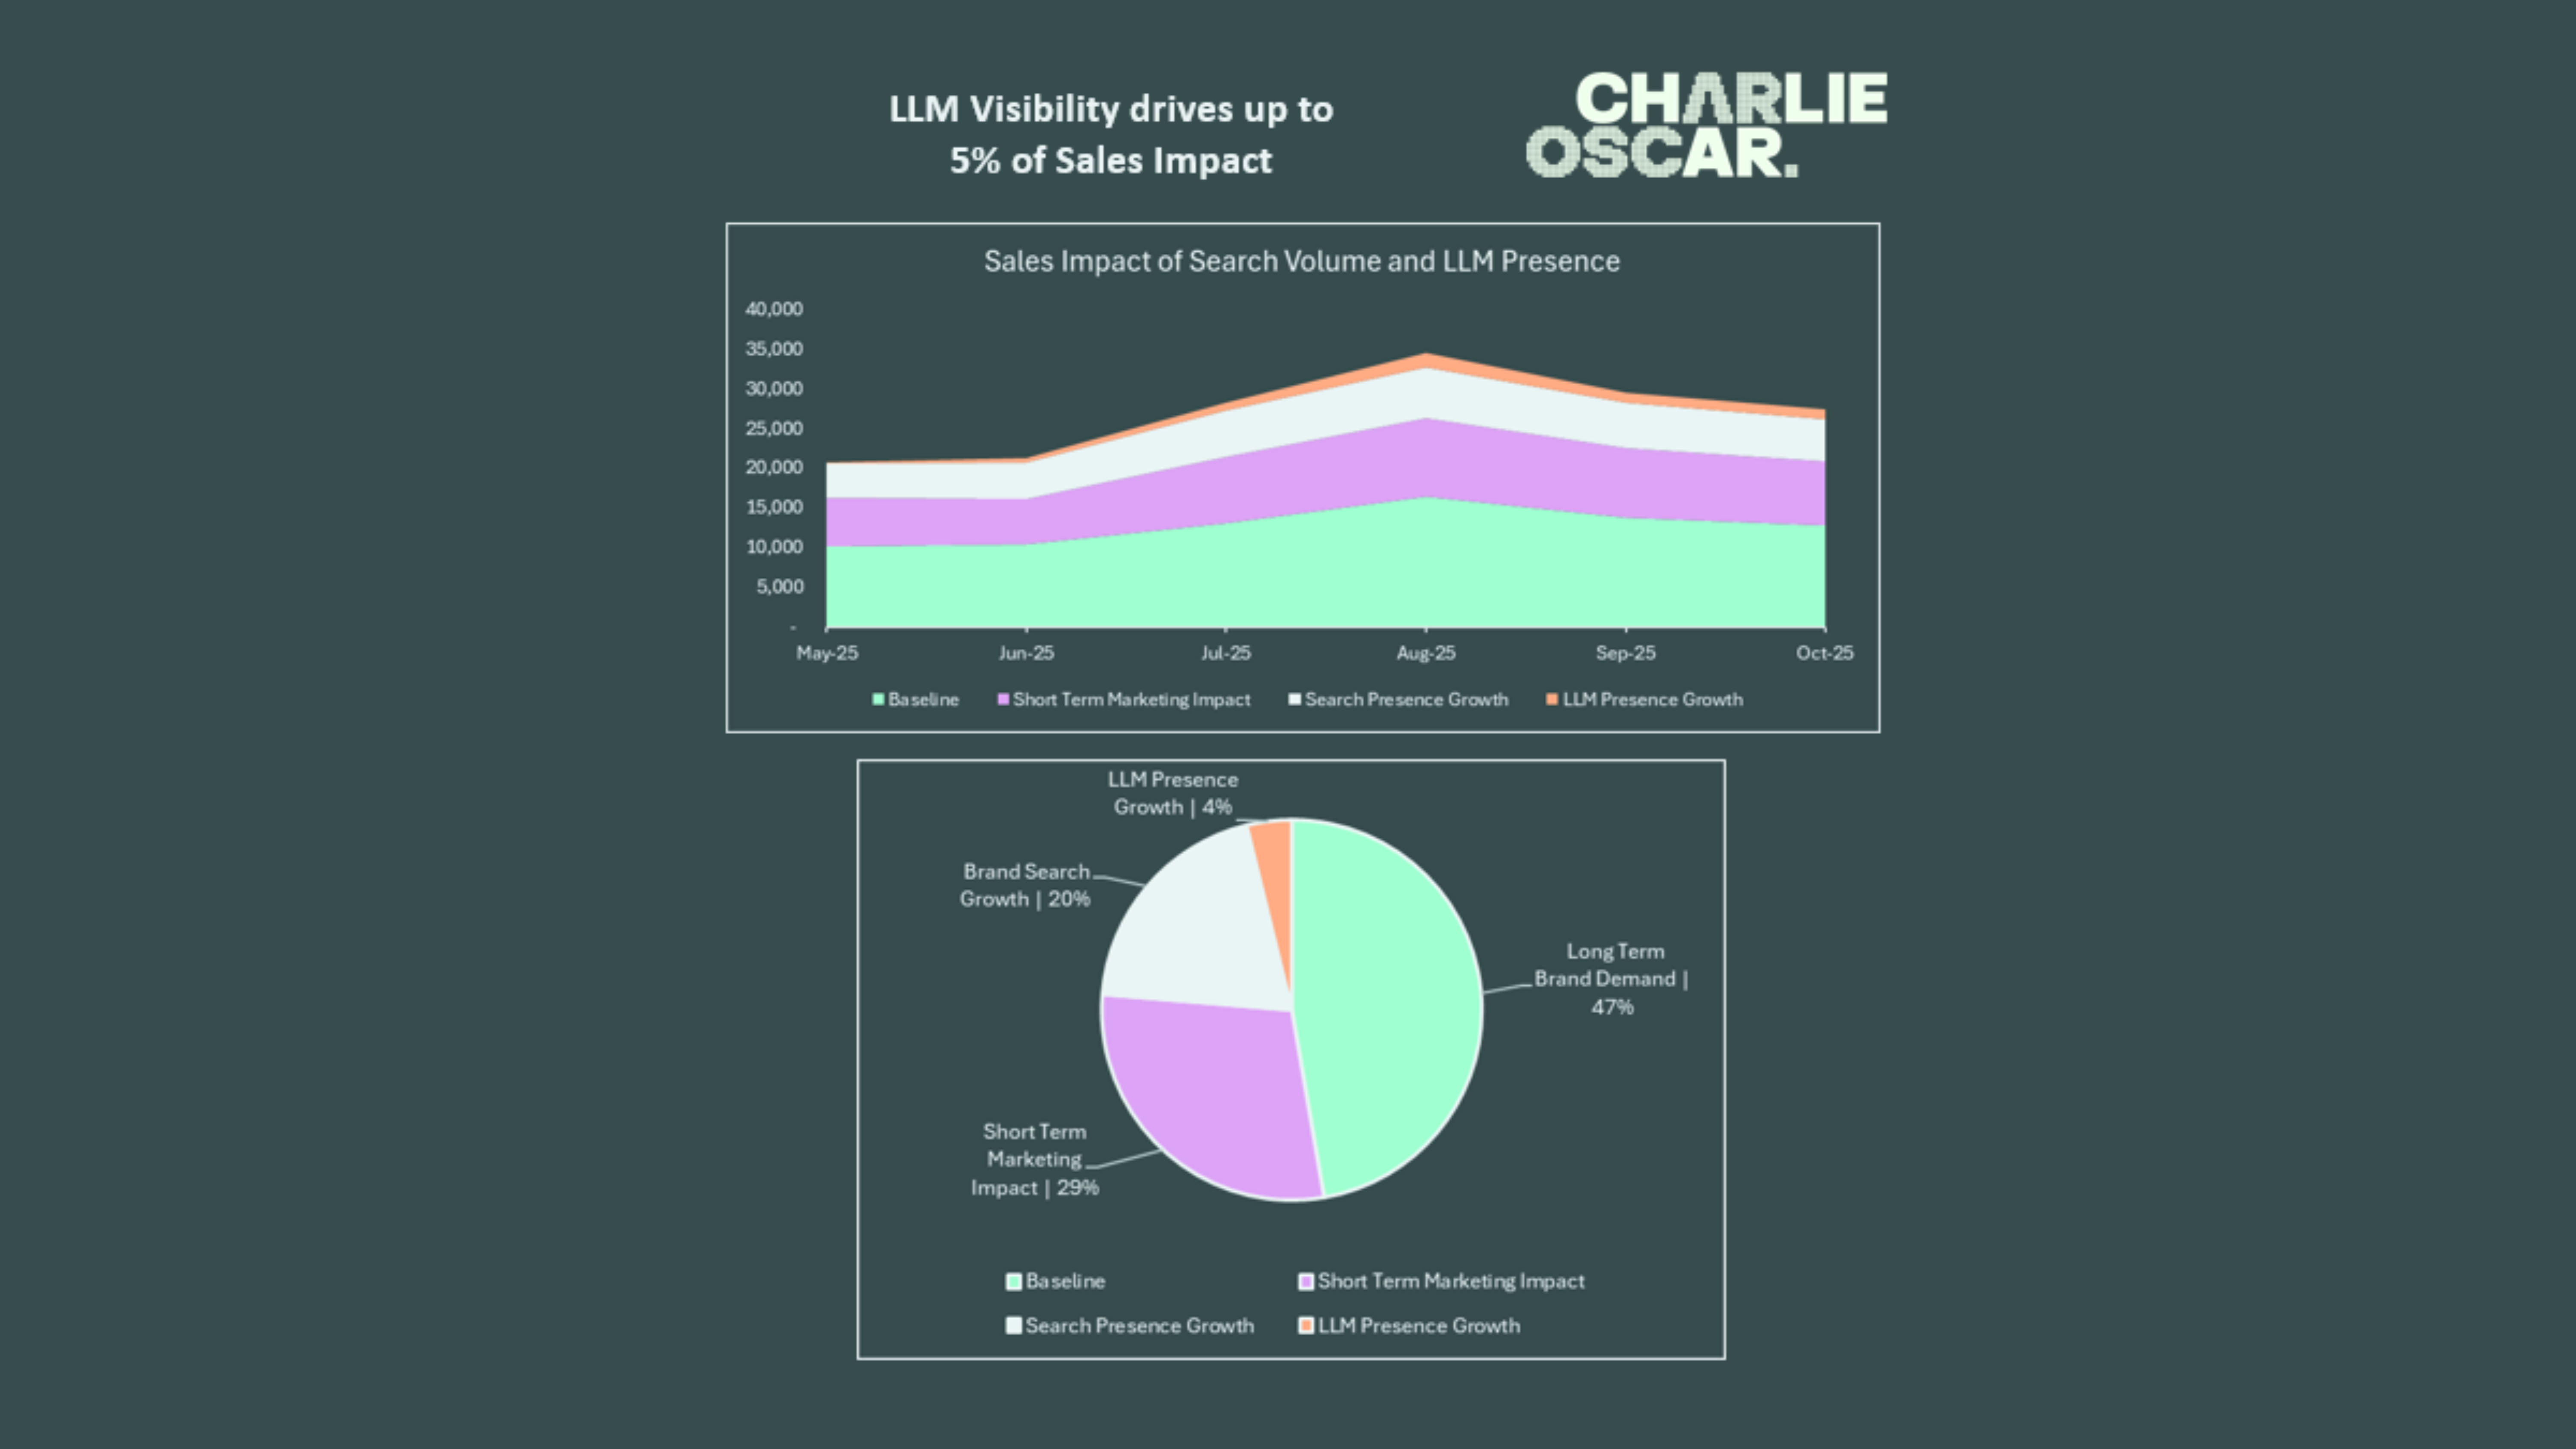
So LLM presence is much smaller than either Search presence, or the direct impact of paid marketing. But it is there, and who is going to turn down a potential additional 5% of business growth.
But it is worth remembering that a lot of that 5% is actually coming from the things we do already.
63% of it from the long term brand growth that would usually sit in our baseline.
26% from the marketing we have already been doing to drive other outcomes.
11% of this growth is attributed to citations which is specifically called out by LLM responses.
11% of 5%. So a net 0.55% of sales volume from getting more citations (or more frequently called out citations.)
Potentially an extra 1.3% if we can get the existing paid marketing and influencer efforts to focus more on LLM presence.
This is likely to grow as ChatGPT embeds more paid offerings into their prompt responses, but that is completely untested so who knows how that will perform.
2% is not going to change your business overnight, but the line on the graph keeps going up so it is probably an area that everyone should care about and it is reassuring to see we can measure some actual business growth beyond some visibility tracking metrics.
My key takeouts:
- The lines all go up. LLM presence is getting more important over time (but from a low current base of actual business impact.)
- The right long term answer isn’t changed, run good marketing and visibility improves (roughly in line with other brand health signals). But you can have some short term tactics to help drive some short term spikes.
- A majority of the value is in using existing marketing presence to drive growth, not focusing exclusively on citations.
- Do everything right, and it will barely make a difference to your next two quarters of results. But could be fundamental to being successful in 2027.
Award Winning Thinking
Featured for big wins across Marketing Science, Influencer, Paid Media, Creative, and Consultancy.