
Most brands have in depth media measurement dashboards, and in depth creative reporting dashboards. And very little link between them.
The channel you’re running on is just the pipe. The creative is the water. Measuring the pipe without measuring what’s flowing through it tells you almost nothing about why performance is up or down.
Why is this campaign working? Or not working?
That question is impossible to answer if you can’t connect creative to media.
The inconvenient truth from CO’s data: creative quality is one of the strongest predictors of incremental revenue, and it’s almost entirely absent from how most brands report on campaign performance.
The metric that most use to judge creative is the wrong one
The most commonly used creative performance metric is CTR. It’s in every platform. It’s easy to compare across campaigns. It gives you a number for every piece of creative, which feels like measurement.
The problem: CTR shows a weak correlation with incremental revenue.
The second most common metric, click attributed conversions or revenue. It is a reflection of exactly the same problem.
Charlie Oscar analysis on Meta campaigns shows that when we compare CTR rankings of creative assets against their modelled incremental revenue contribution, the correlation is low.
A high-CTR creative simply isn’t reliably a high-revenue creative.
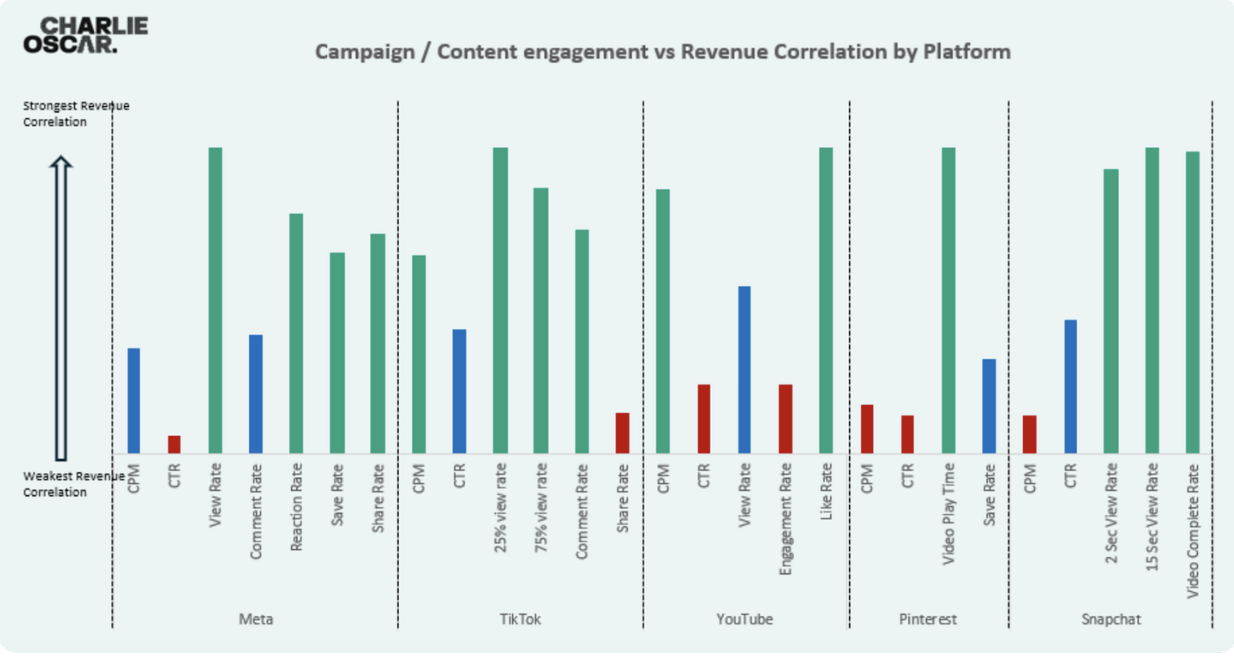
The metrics that actually predict incremental revenue are view rate, reaction rate, and save rate. These measure whether someone genuinely engaged with the content not whether they reflexively clicked through.
A piece of creative with a high CTR might be a great direct-response asset. It might also be a misleading thumbnail that drives clicks with no downstream intent.
CTR cannot tell the difference.
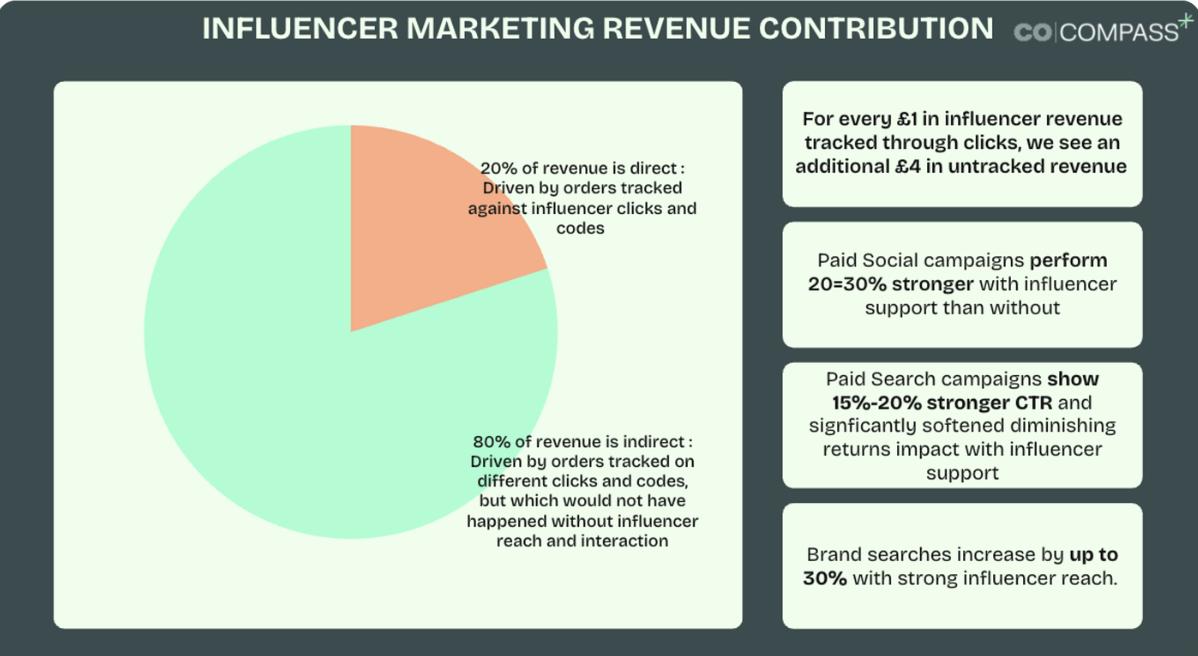
80% of paid social impact is passive, for people who never click on ads. CTR and click derived conversion metrics will never see that value. It means that every creative optimisation choice is made on a misleading 20% of impact.
Creator campaigns are being systematically undermeasured
Most brands measure creator and influencer campaigns through tracked links and promo codes.
These capture roughly 20% of the real commercial impact.
The other 80% is indirect. It works through brand perception, social proof, the downstream effect on how audiences respond to paid campaigns, and the organic reach effect on branded search and direct traffic.
Charlie Oscar runs a lot of MMM studies on creator campaigns, both organic reach and paid amplification. We see this consistently across every creator MMM study we run, tracked links can only see demand that clicks through to a conversion.
They can’t see demand that was created by a piece of content and then converted through a completely different channel three weeks later.
Strongest content makes your paid media work harder
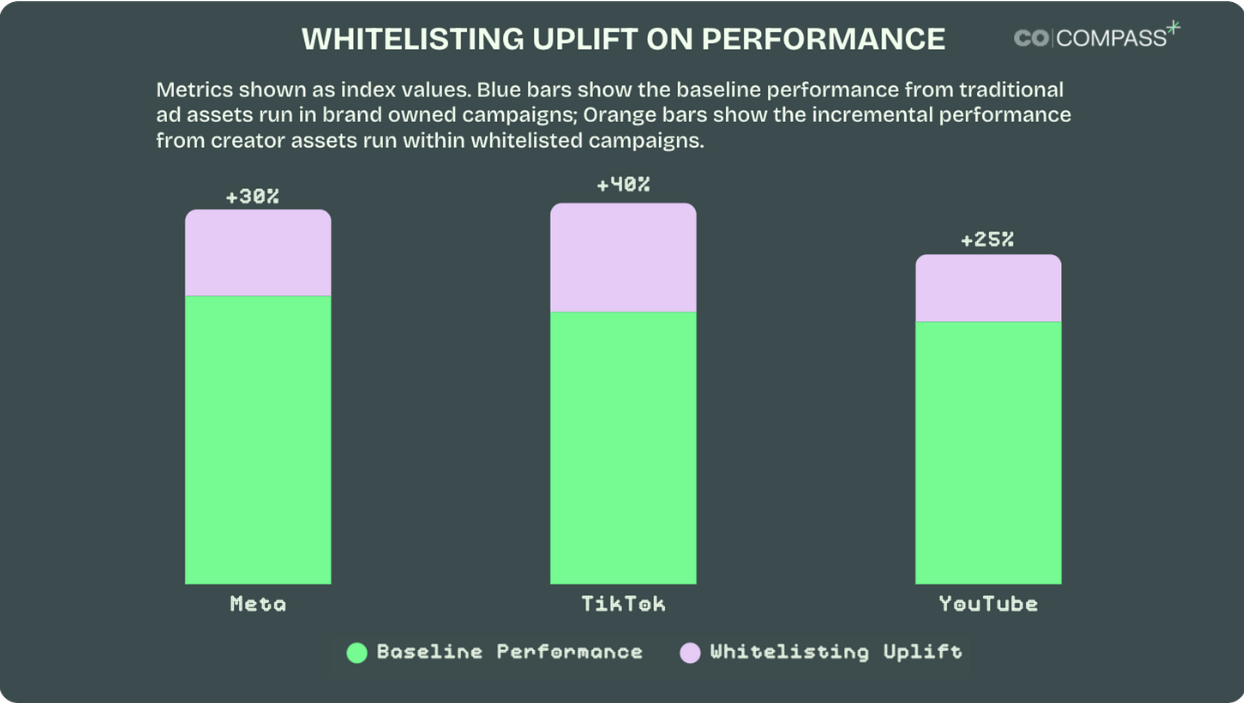
Strong content, particularly creator content, drives synergy effects on paid media amplification.
It makes every pound and dollar of marketing spend work harder.
When creator content is run as paid ads, Meta performance improves 30%, TikTok by 40% and YouTube by 25%.
This is the connection between media and creative reporting. The media performance improved, but not by changing tactics or adjusting settings but by changing the quality of engagement and the data signal being fed to the platform algorithms.
You have to be able to connect these reporting outputs across media and creative to be able to identify when this performance is driven by changes in media tactics and when they are driven by changes in creative effectiveness.
As these measures come from MMM (COmpass), they are aligned to incremental business impact, not platform attributed response.
The false choice between data and creativity
The data versus creativity debate is one of the more persistent false dichotomies in marketing.
Data doesn’t constrain creativity. It tells you where creative risk is worth taking. Playing it safe (running only proven formats, well-worn messaging, low-risk executions) doesn’t produce stability.
It produces slow, invisible decline. The in-platform metrics look fine. The brand slowly becomes less interesting to more people.
If you can isolate the real impact of both creative and media, then you know which of your changes has moved the dial. Moving the dial on the real business numbers that matter
Run your own correlation studies, which creative metrics actually align to your business performance (Business performance, not platform reported performance). It won’t be CTR. It will likely vary by platform.
Use those metrics to isolate when your media performance is improving due to media choices and when it is improving due to creative effectiveness.
Monitor brand health as a downstream signal of whether the creative is working above the purchase funnel.
And when the data tells you an unexpected or risky creative format is performing, let it perform. Advertising used to be risky, people used data as an excuse to be safe. But the most effective performance continues to come from managed risk.
FAQ
How do I measure the indirect impact of creative and creator campaigns?
Charlie Oscar runs MMM to show both the direct and indirect impact of creator campaigns, which is the most effective way to understand real business impact of creators. You can validate these outputs through brand tracking and uplift studies (for paid amplification) .
If CTR is a bad creative metric, what should I use instead?
This will vary by brand and platform. But there are several better alternatives. For video: view rate (% who watched past 3 seconds), completion rate, and save rate. For static: reaction rate (likes/shares divided by impressions), save rate, and comment quality (LLMs are good at classifying these comments).
How do I separate channel performance from creative performance in my reporting?
The simplest method: hold the creative constant and vary the channel, or hold the channel constant and vary the creative. Platform A/B creative tests do this within a channel. Cross-channel holdouts do this within a creative. These tests are messy, but give good directional signal. MMM is a great method for increasing the speed and scale of this measurement without increasing the opportunity cost through A/B tests.
Is brand health tracking worth the cost for a mid-size brand?
Yes, Charlie Oscar and Tracksuit produced research to prove why. A 1% movement in consideration generates a measurable 3.5% uplift in branded search in the same month. A 1% shift in preference shows a 2.7% share of search gain. These are leading indicators that platform attribution will never surface. If you want to drive long term sustainable growth then you need to generate brand uplift, not just platform performance.