There is a fundamental problem with every paid marketing report.
Including ours.
Open any standard report, and you see the same comforting grid. Spend and delivery by channel sit neatly alongside the revenue generated by that channel. Regardless of your attribution model, the metrics line up in the same columns, in the same tables:
Google spent this. Delivered this. Generated this.
Meta spent this. Delivered this. Generated this.
TV spent this. Delivered this. Generated this.
It looks clean. It looks logical. But it isn’t true.
These reports rely on a fiction: that channels operate in isolation. They assume that if you spend £1 on Google, the result belongs entirely to Google. But marketing ecosystems do not work like that.
The connectivity of spend
Even if you possess strong incrementality measurement, you cannot treat report lines independently. If you turn off TV, the Google line changes. If you scale back on social, your direct traffic wavers.
We measure channel interaction constantly. We calculate how an action in one channel impacts the effectiveness of another. The data paints a clear picture of interconnected performance.
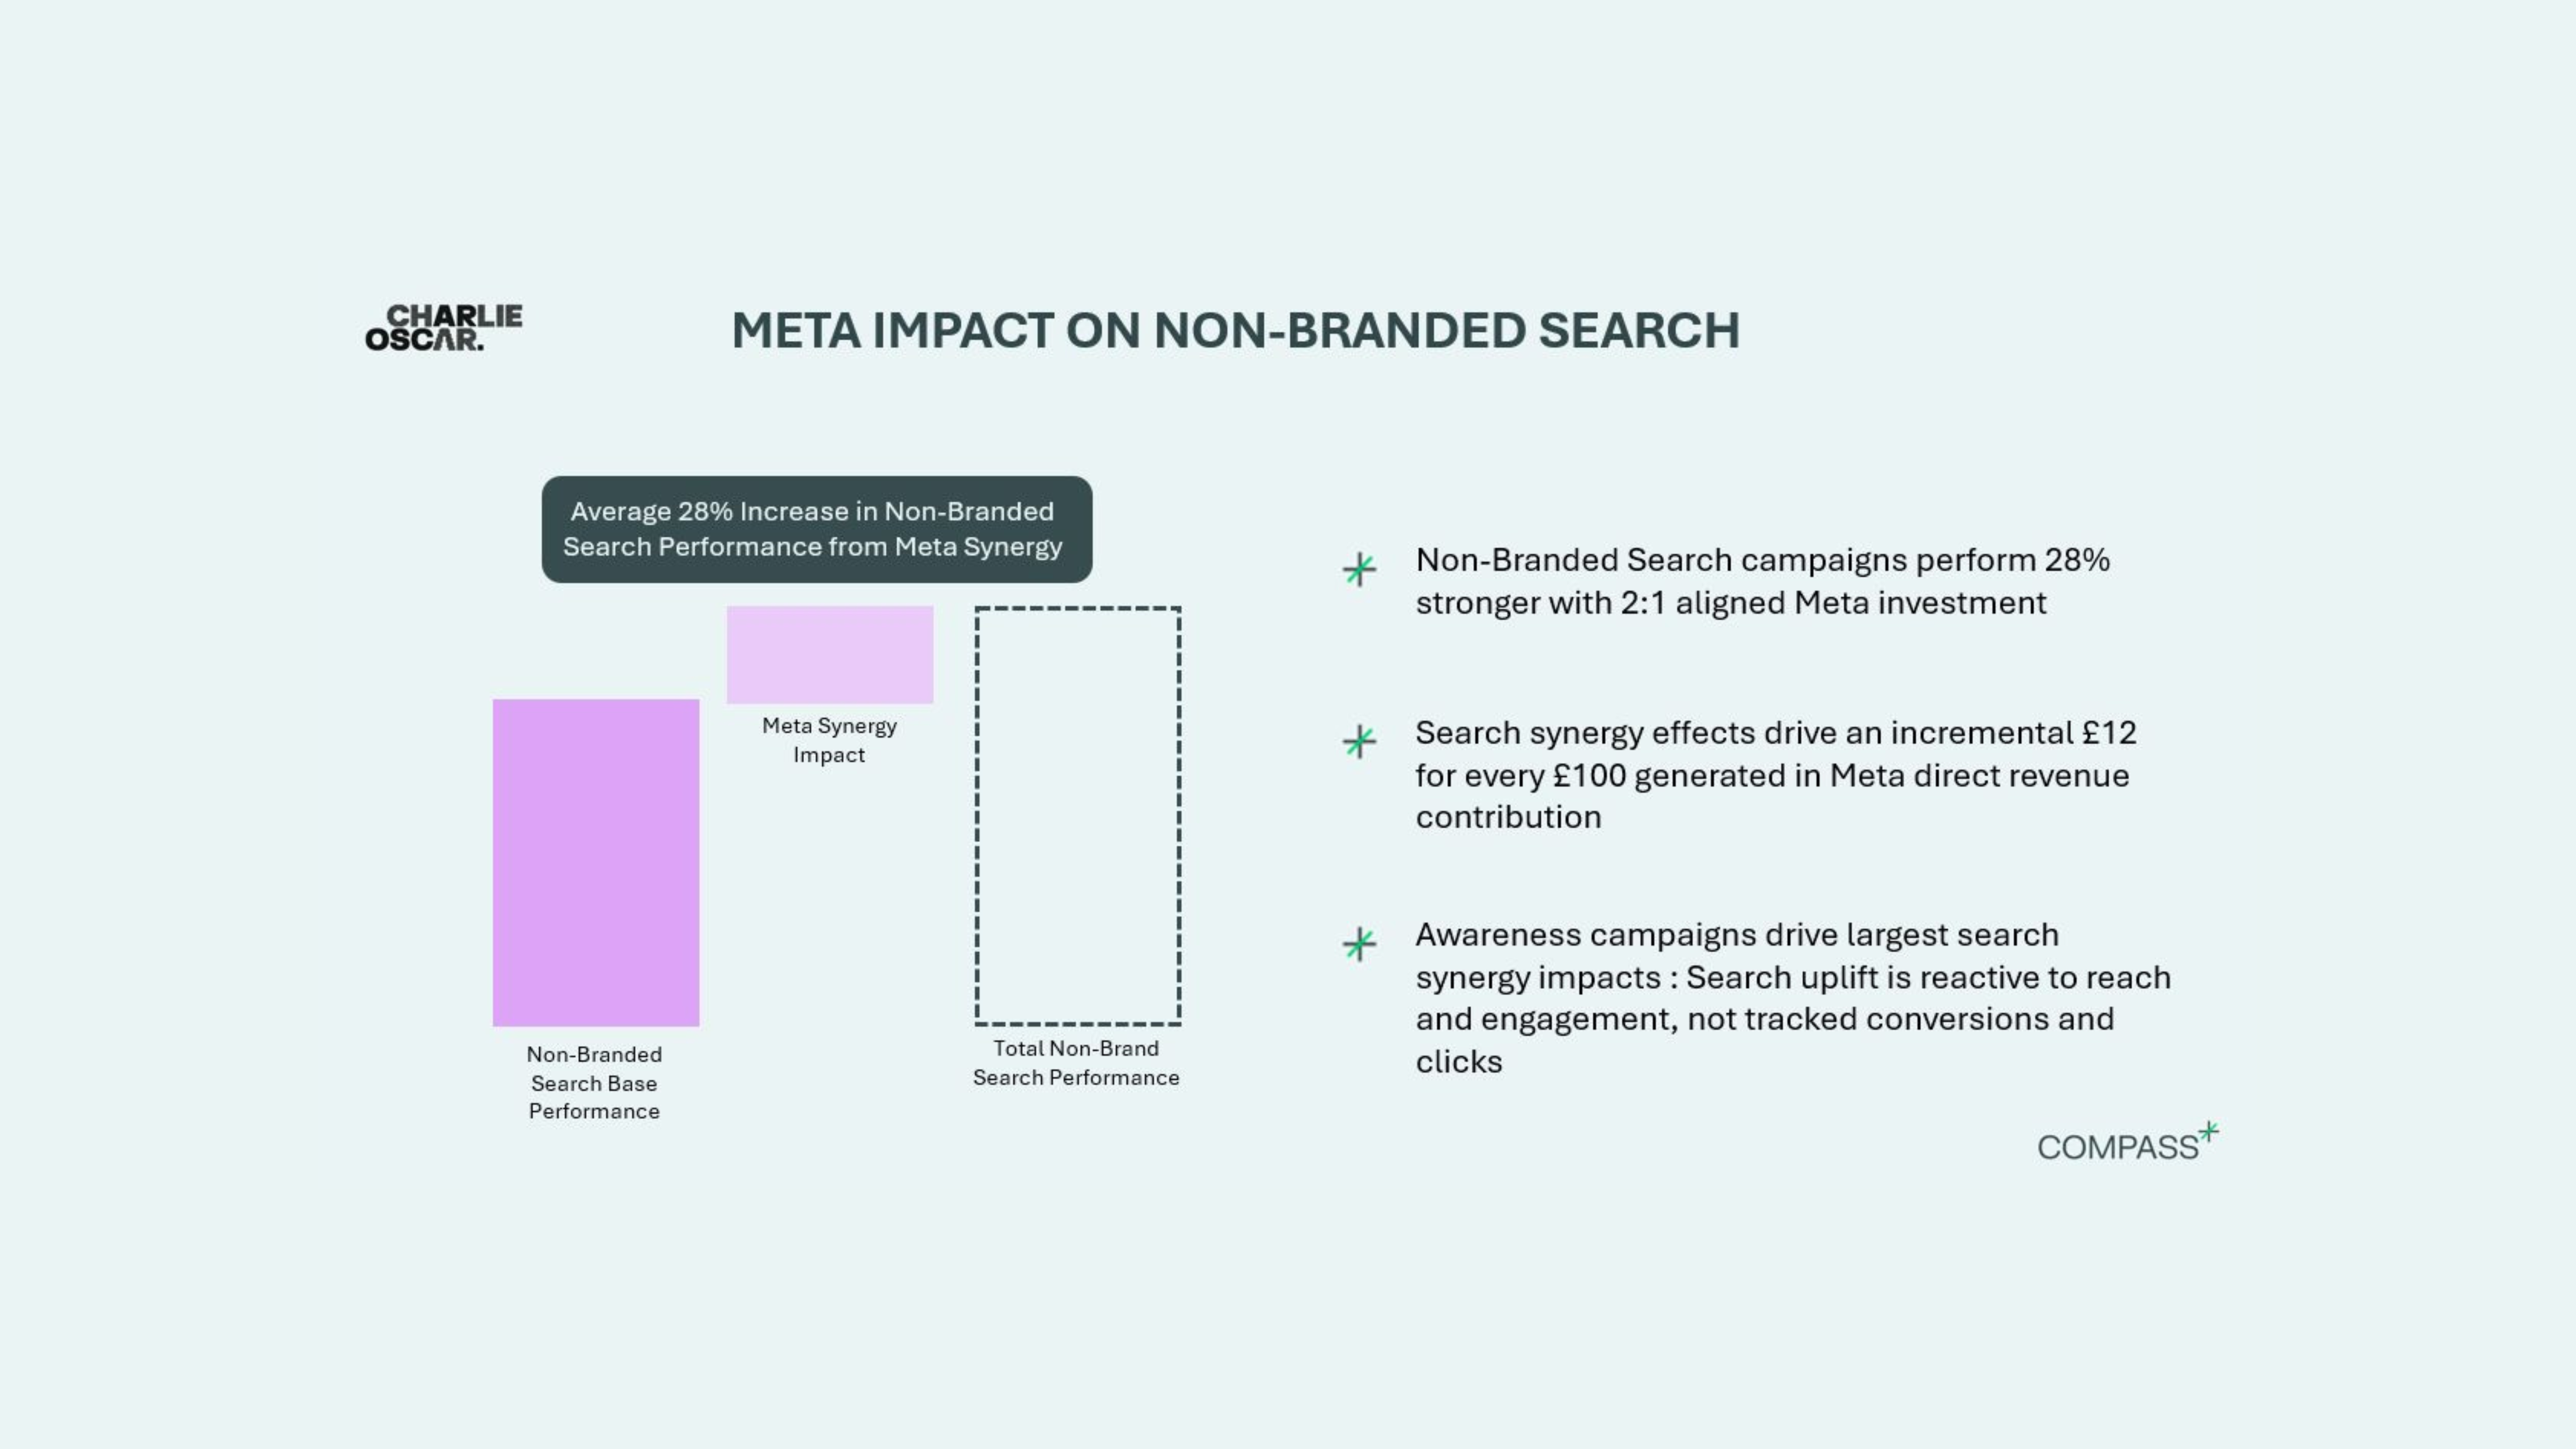
Our case studies reveal that Non-Brand Google search campaigns are 28% more effective when paired with matching Meta investment than when run in isolation.
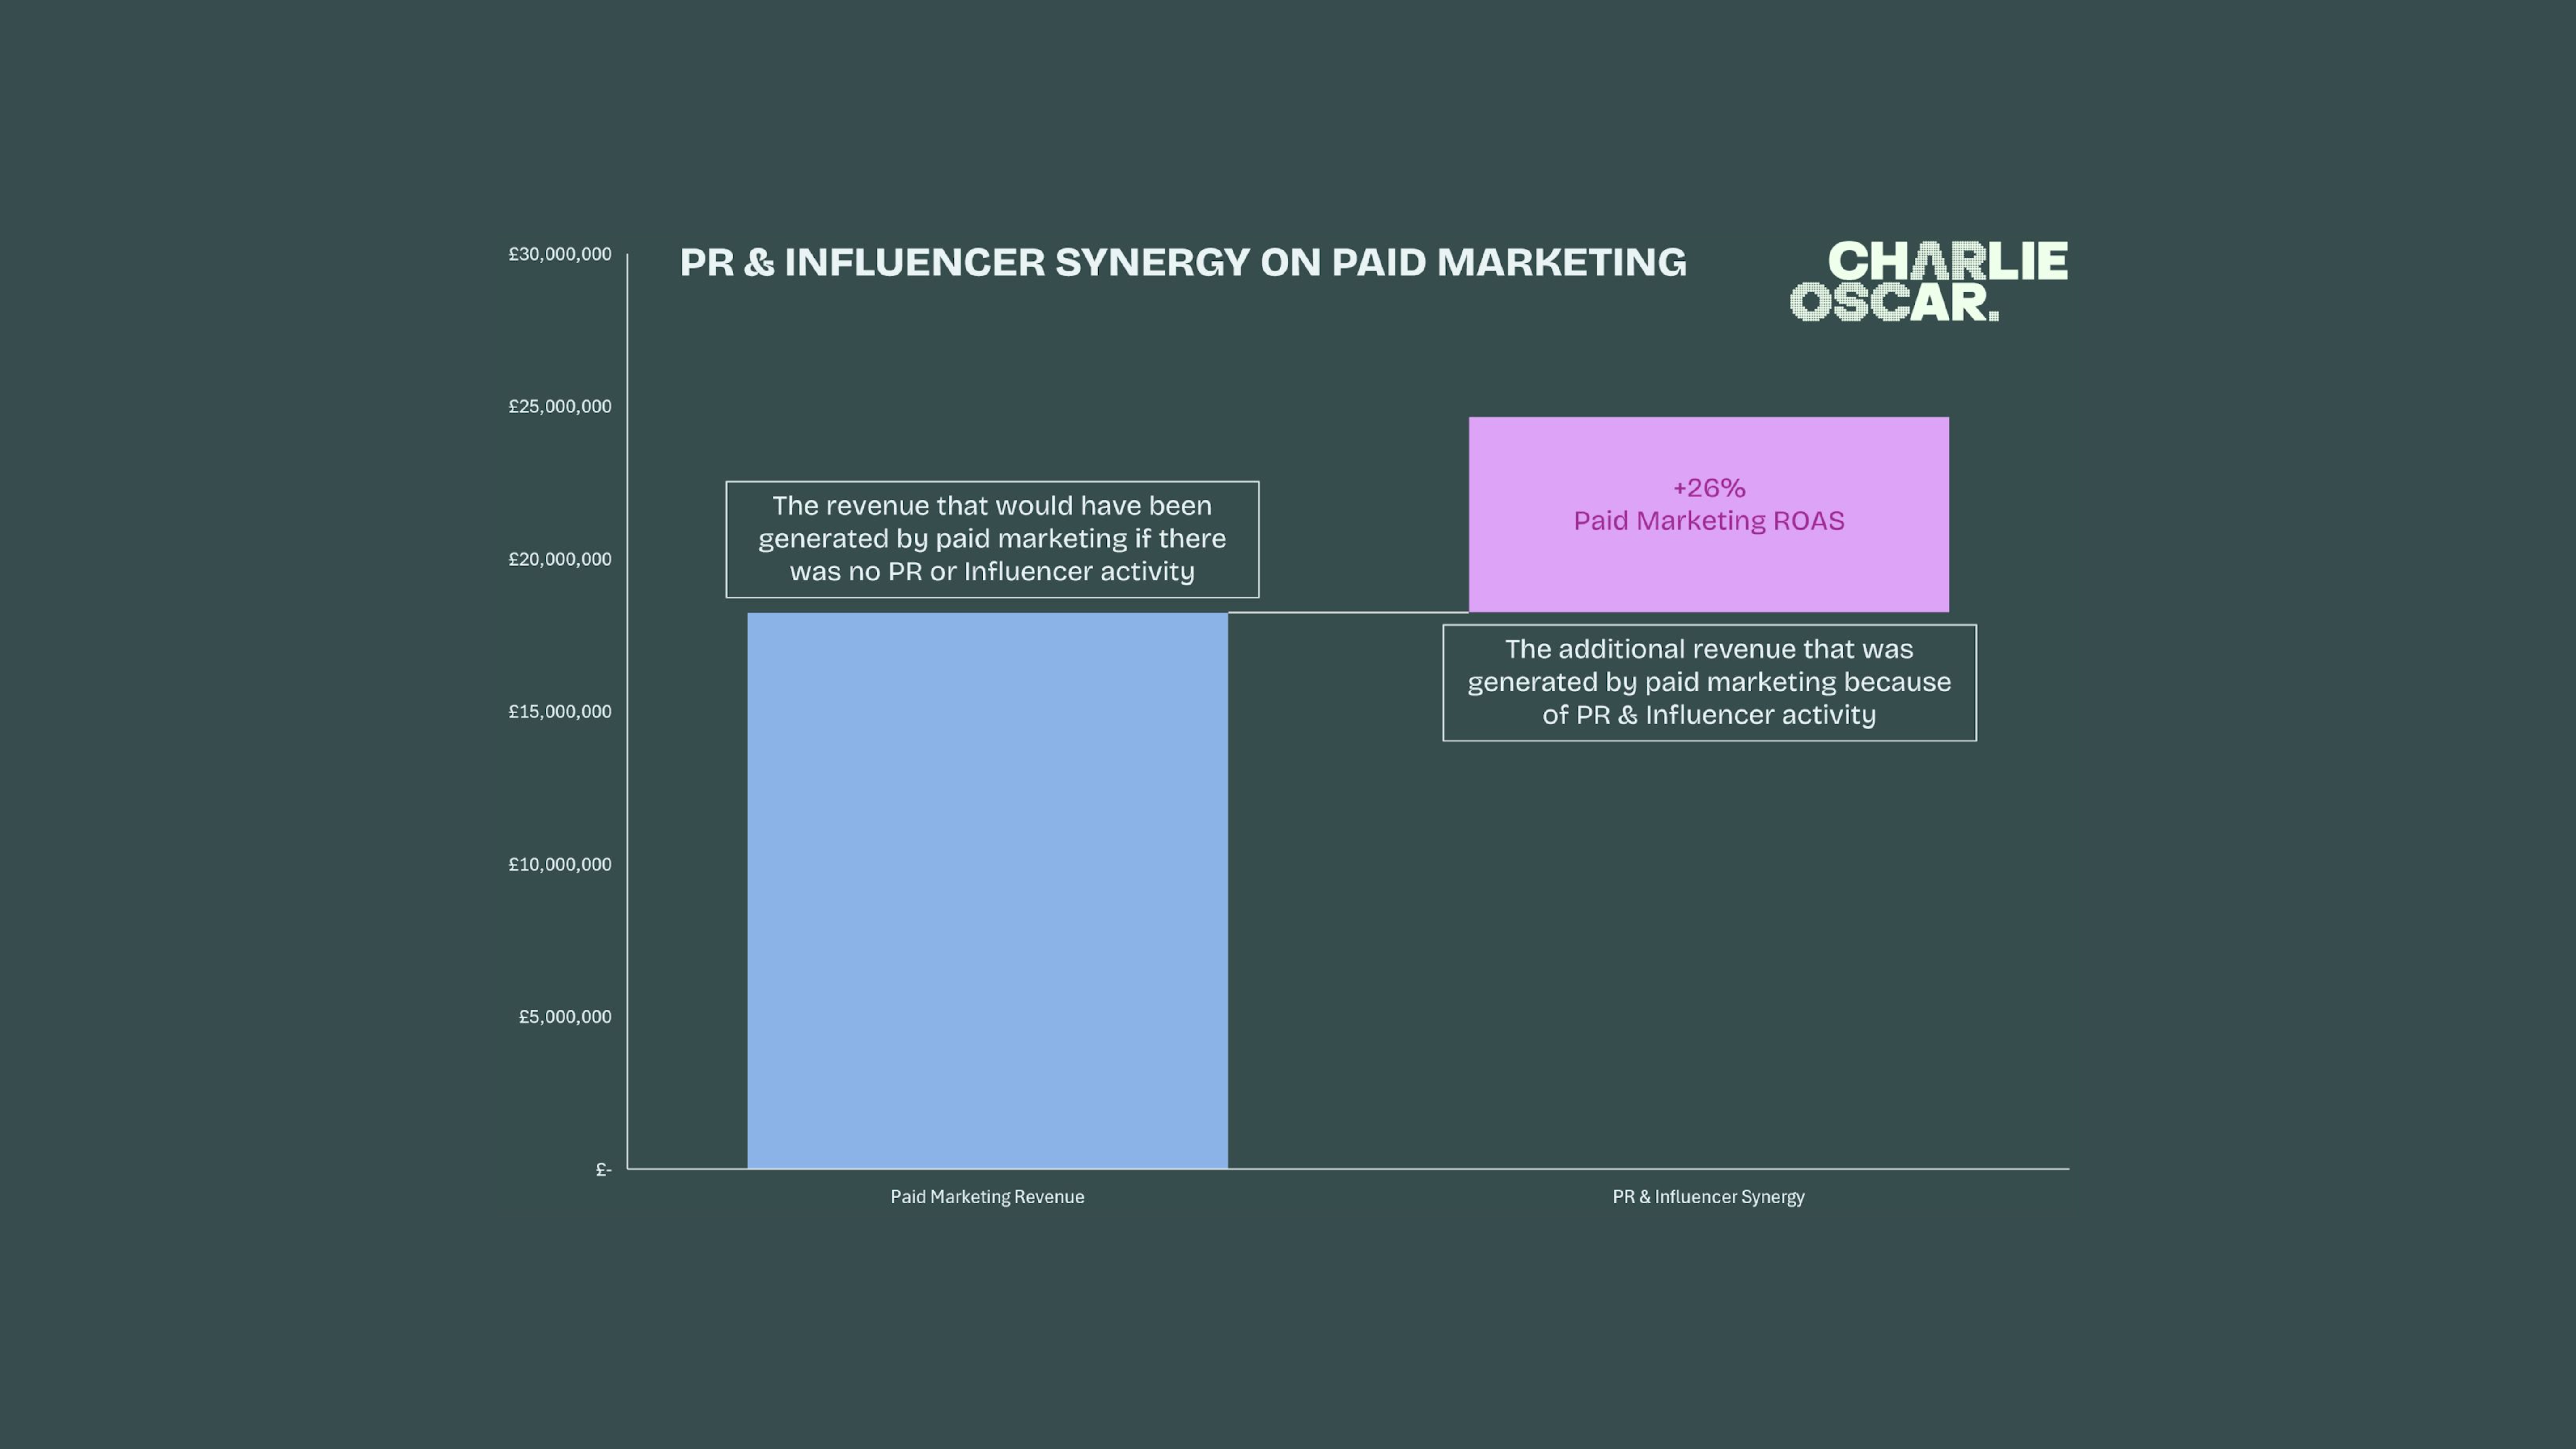
Furthermore, Paid Marketing is 26% more effective when supported by strong PR & Influencer coverage.
The revenue from the search campaign wouldn’t exist at that volume without the Meta support. Yet, the search campaign captured the demand that Meta helped generate. The value is shared. The performance is collective.
The spreadsheet dilemma
This reality breaks the standard reporting model. Where do you put that 28% uplift in your nice marketing spreadsheet?
You cannot put it solely in the Google row; that ignores the investment in Meta. You cannot put it solely in the Meta row; that ignores the capture mechanism of Search. You could arbitrarily split the revenue between the two, but that renders the data pointless for making real strategic decisions.
To accurately report this, you would need a line for every combination of channels.
For a simple plan with five channels, you would suddenly need a report with 120 rows. If you are brave enough to run eight different channels, look forward to analysing 40,000 rows of marketing reports.
Context is your competitive advantage
We cannot build reports that account for every variable without drowning in data. But we can change how we read them.
A report is a snapshot, not the whole story. Data requires context. Without that context, you risk taking actions that damage your wider ecosystem.
When you look at a ‘poorly performing’ channel and decide to cut spend, remember the 28% uplift. Shifting spend on one channel will impact your performance elsewhere.
Don’t just read the rows. Read the relationship between them. That is where the real growth happens.