
It’s tough running a high street store.
For years the landlord put the rent up, and every year you found the margin to cover it.
Then one year the rent increase eased, but instead the landlord subdivided the building and let three more shops open either side of you.
Your costs are slightly easier. Your footfall is now split four ways.
Just when you thought you had got on top of one problem, the landlord threw in another.
Except that isn’t a high street store, it is every brand who advertises on Meta.
Price inflation hurts efficiency, while increased ad load challenges effectiveness.
Meta revenue keeps going up. It continues to be (one of) the first platforms everyone needs to master to grow a digital brand.
But the reason it keeps going up changed, and the challenges changed with it.
The bars just keep getting bigger.
The two numbers
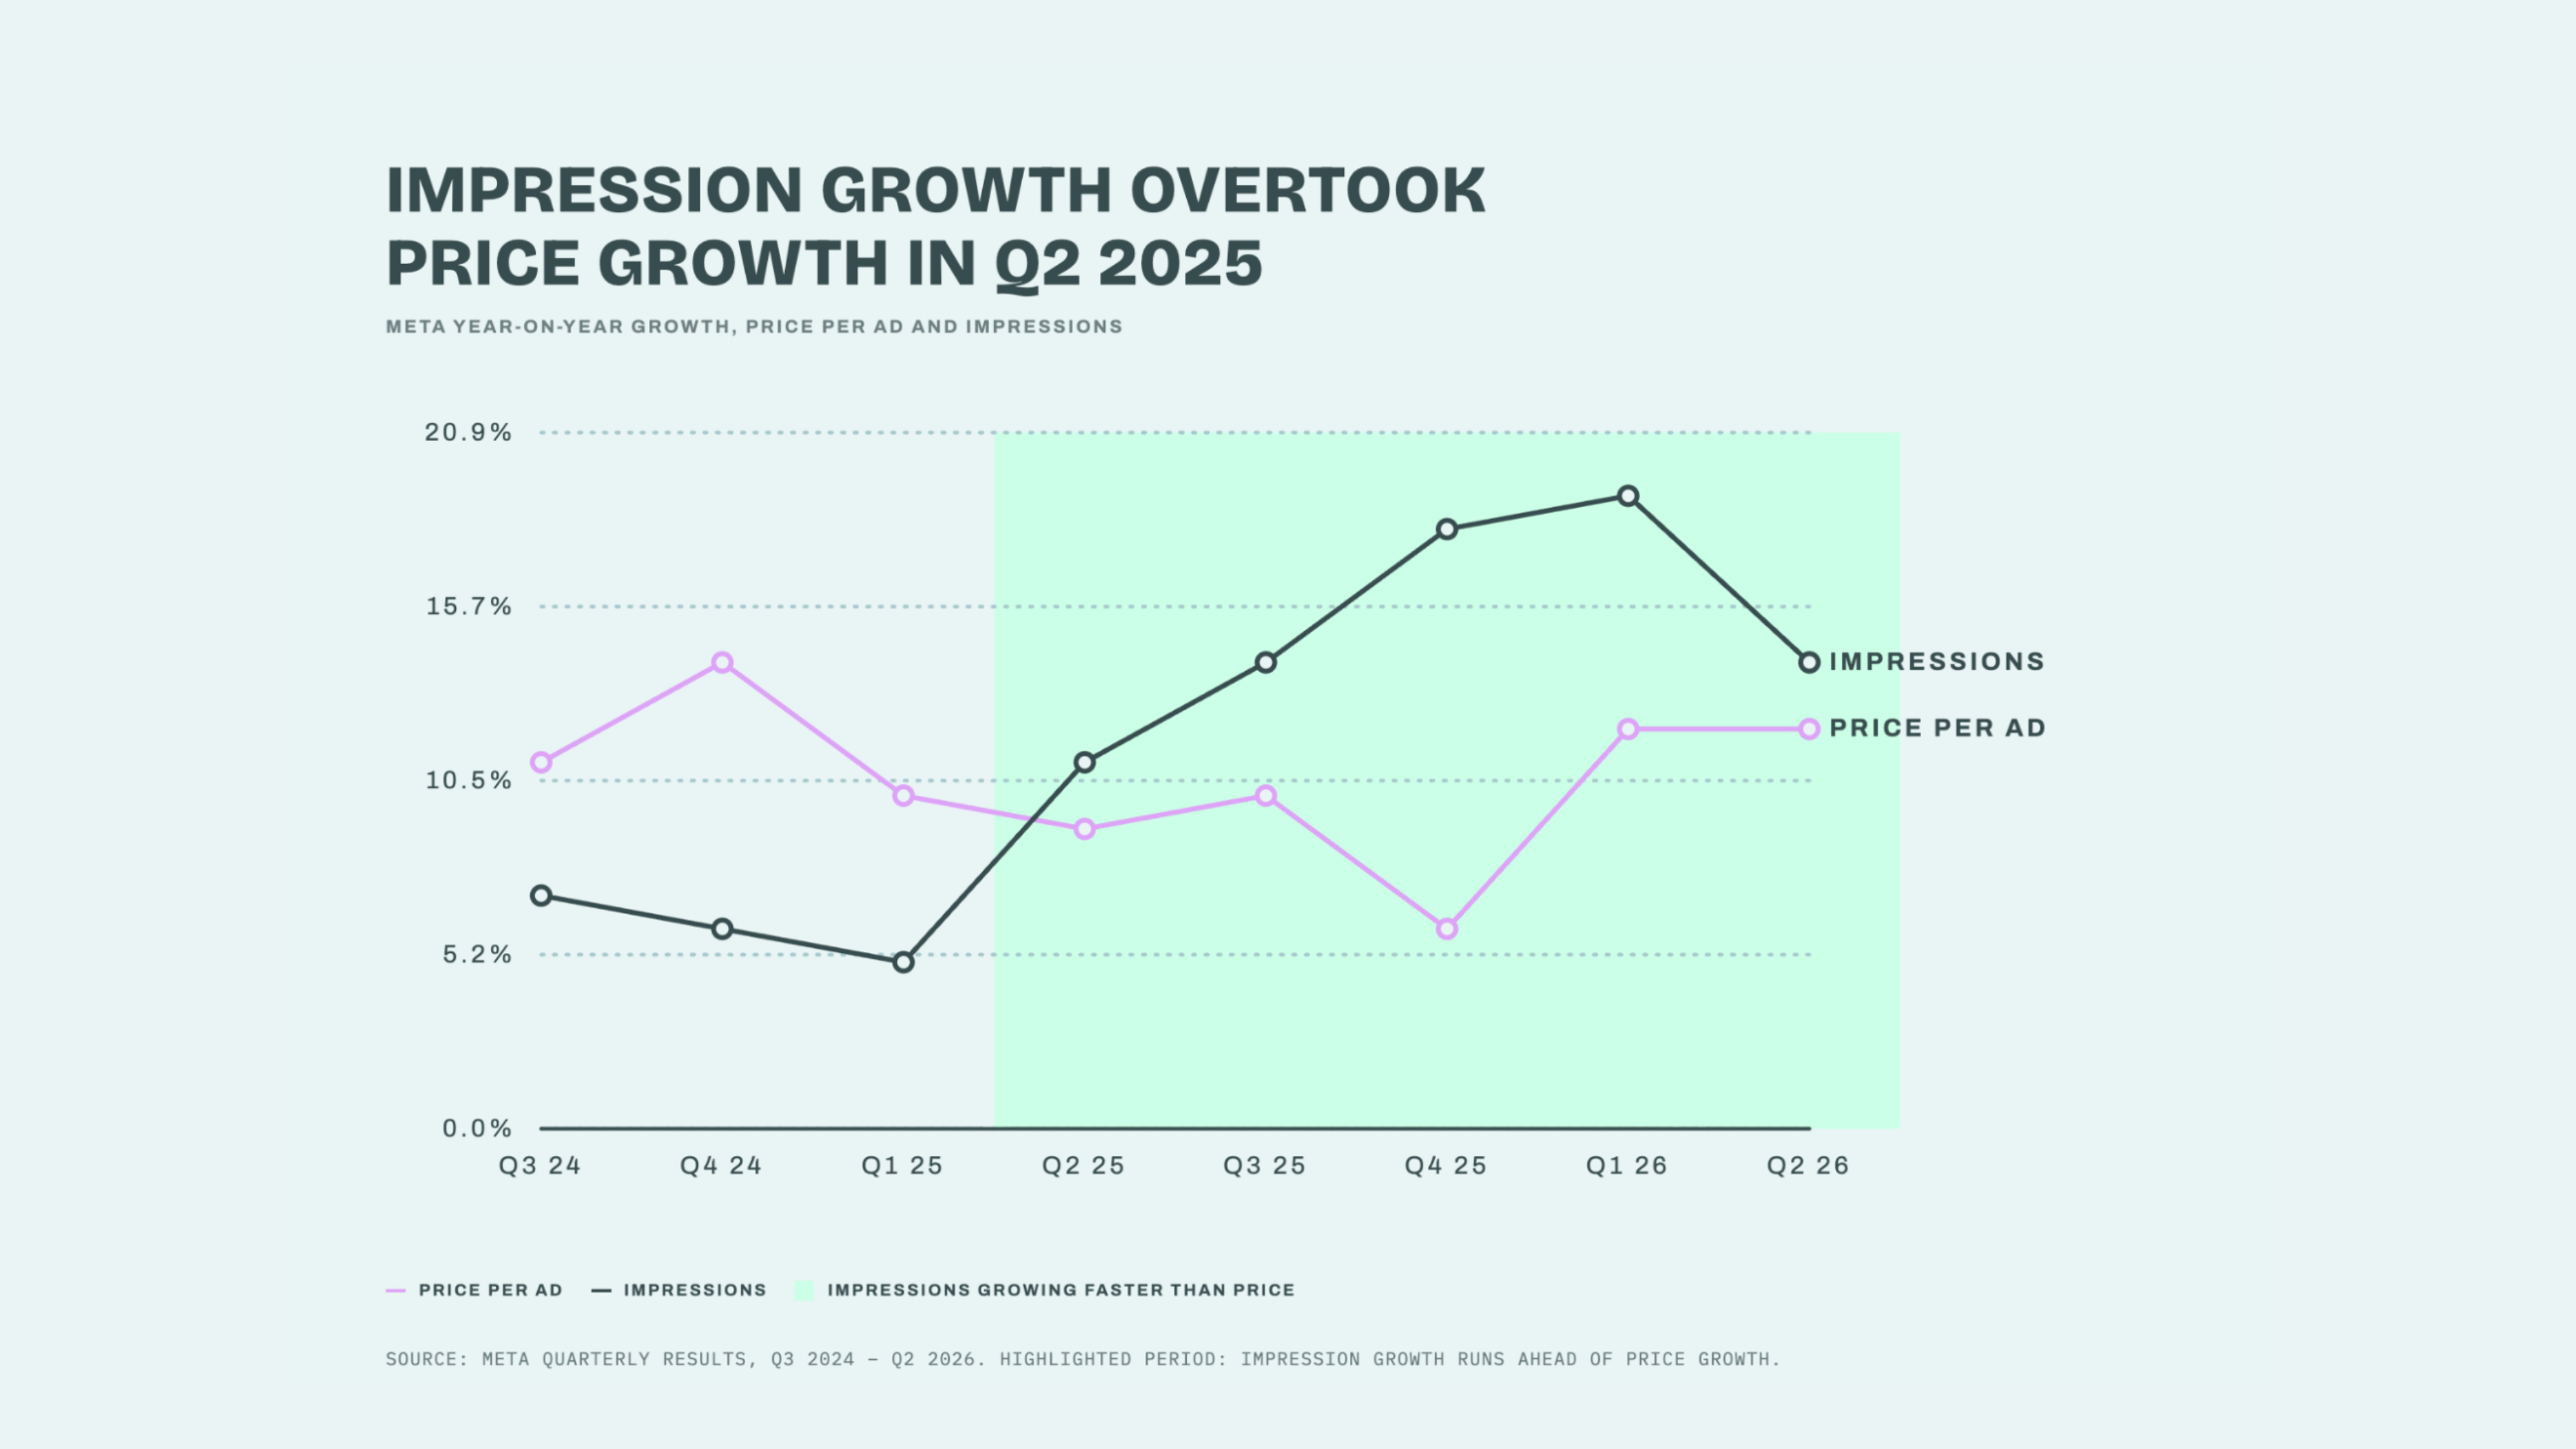
Meta’s revenue from their ad business is the combination of two numbers. How many ads it delivered, and the average price it got for them.
Luckily, both are published every quarter, and which of the two is doing the work tells you a lot about how ads on the platform actually behave.
Meta also publishes daily active people, which lets us split the impression growth into two very different things: more people to serve ads to, or more ads served to each person.
Phase one: the price story
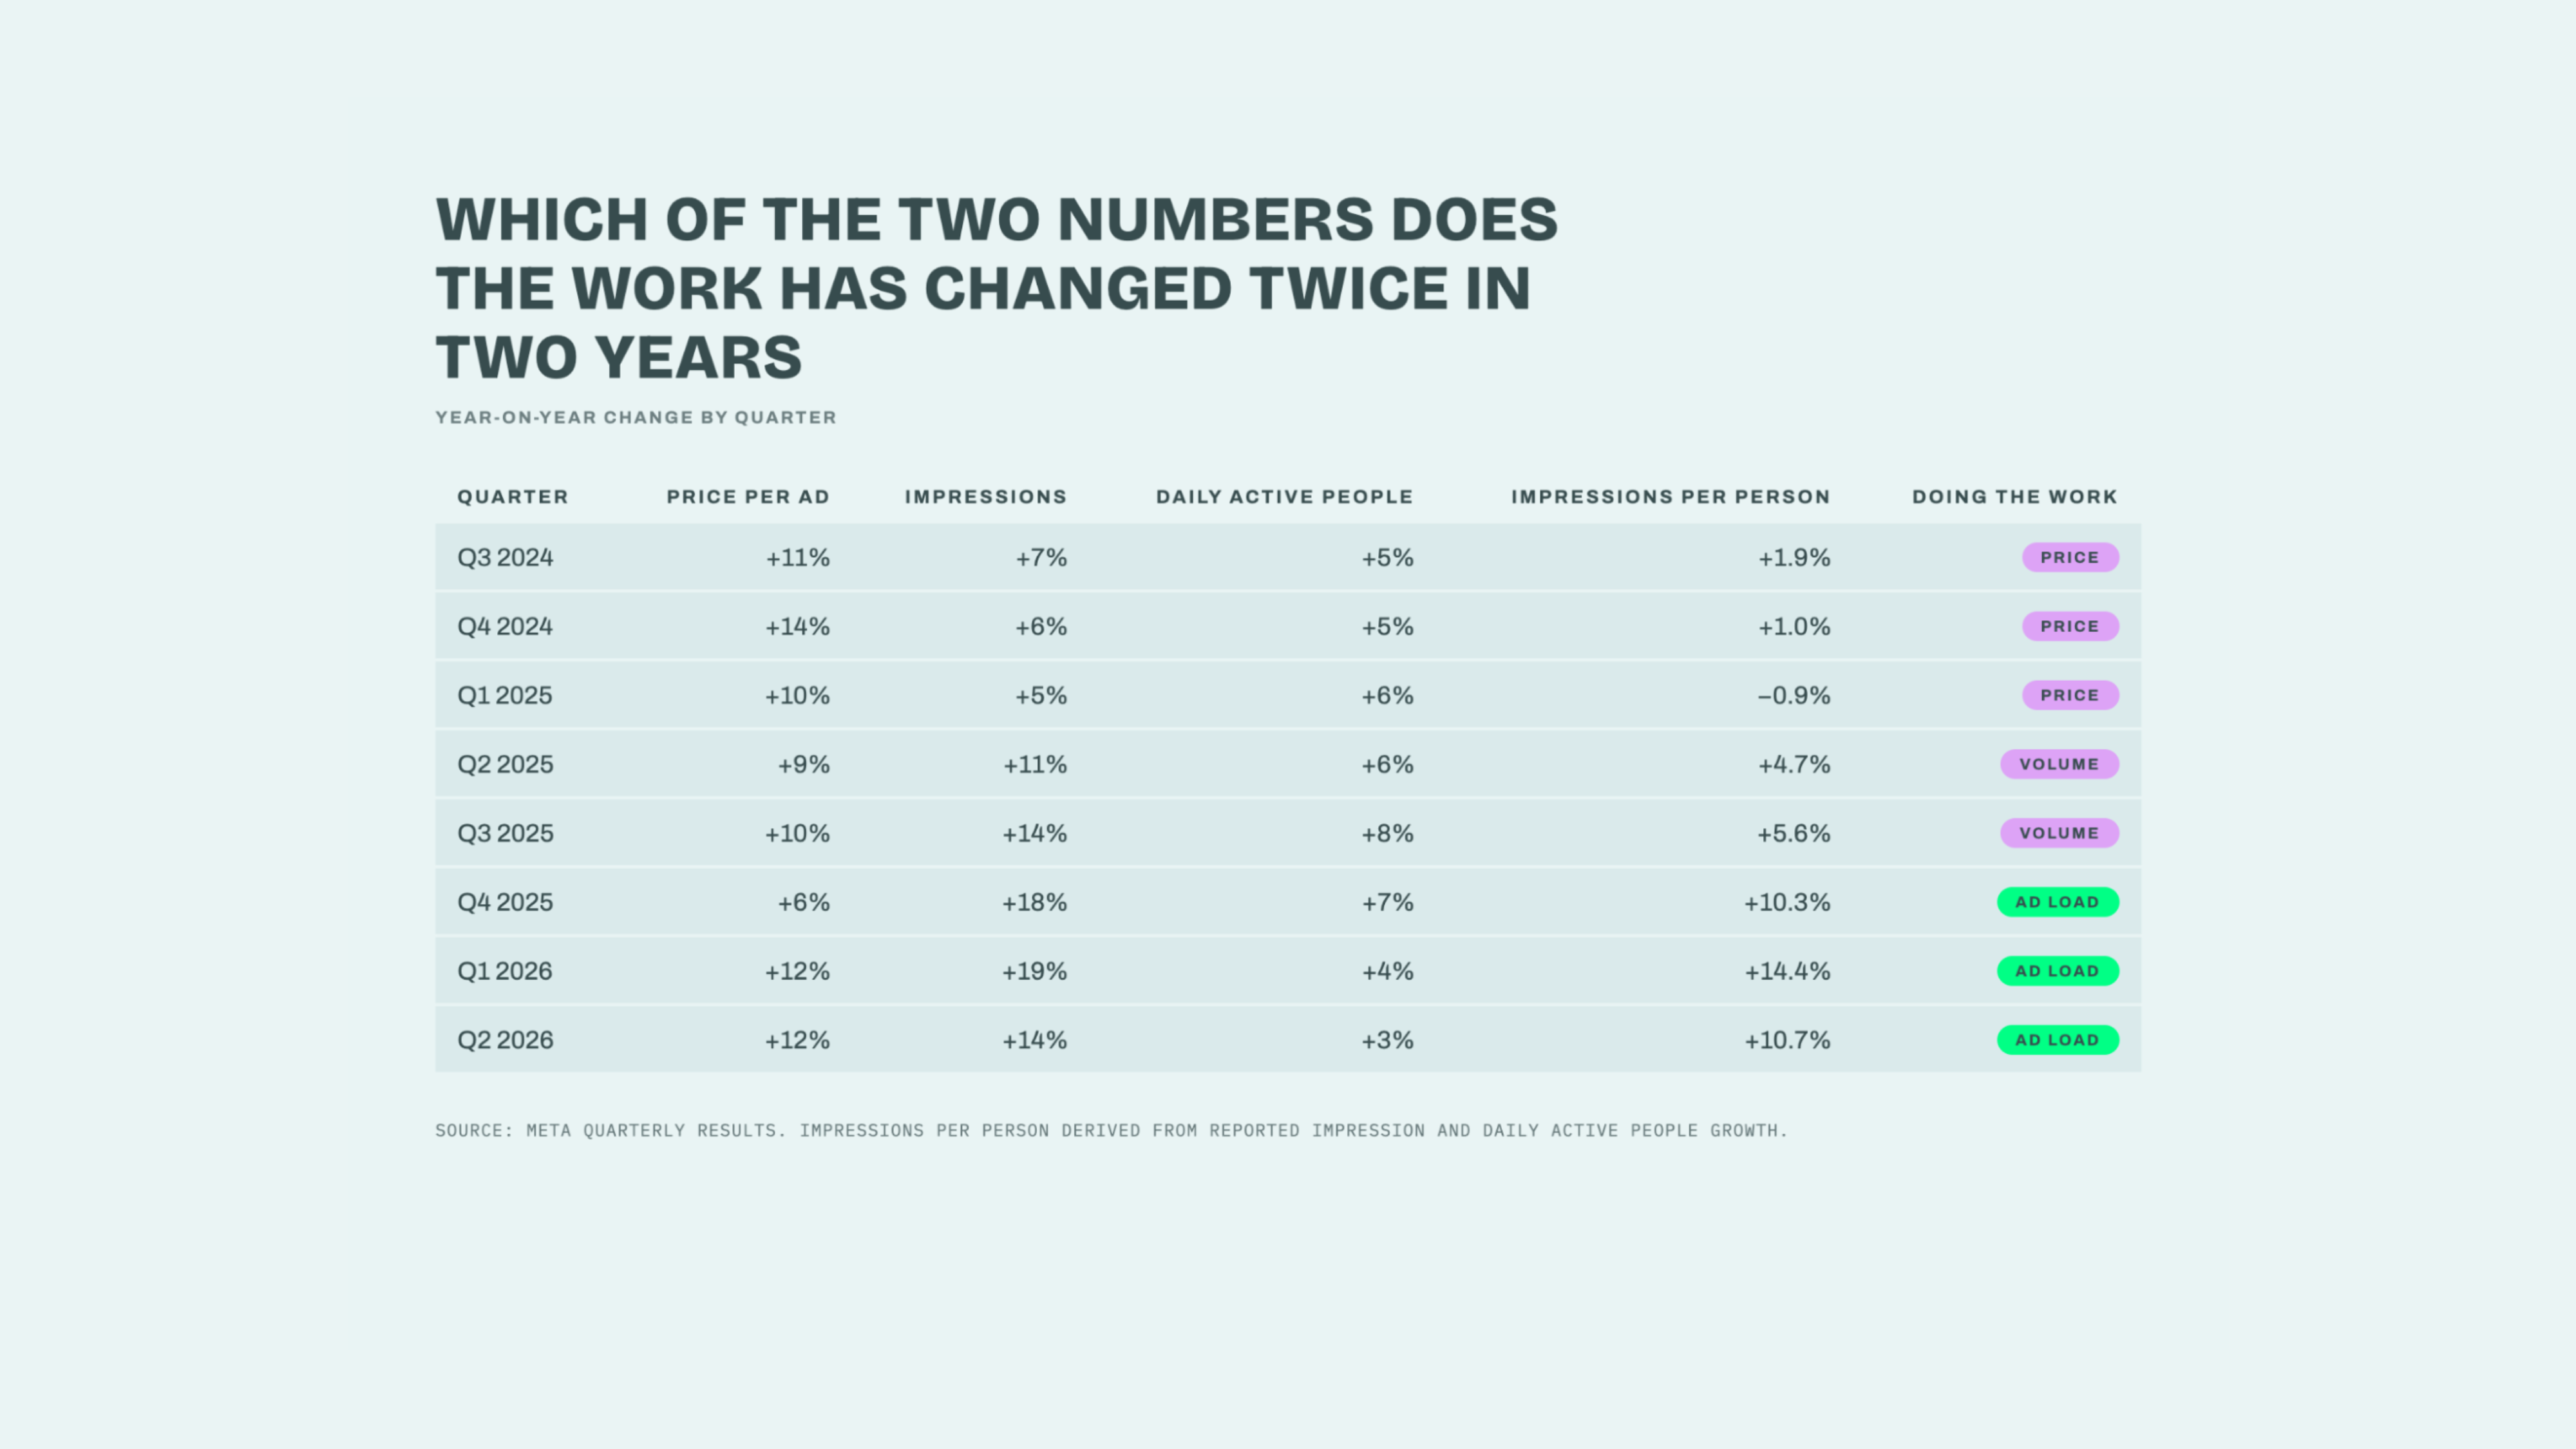
The first three quarters show price growth running ahead of volume growth, and the gap widening. Meta selling attention at a far higher price while the quantity of it grew far more slowly.
Impressions grow roughly in line with user growth, so a similar relative ad load being served to more users at a significantly higher price.
That shows the inventory being valued highly by the market, but it also shows every marketer’s job getting harder quarter on quarter.
You need to match 10% cost inflation just to stand still.
There was a lot of attention on that cost inflation, and on the tightening auction. It set the tone for conversations over the following quarters, even though the underlying challenge actually changed.
Phase two: Meta builds more shelf space
The relationship changes in Q2 2025, and continues for the rest of 2025. By the fourth quarter of 2025, the market had flipped. Price up 6%, impressions up 18%.
Three times as much new inventory as new price. The revenue growth is coming from being able to serve more ads.
The increase in supply reduces some of the price pressure (but only slightly). While significantly increasing available audience. This is the positive part of the story for advertisers (though it didn’t always feel like it.)
Phase three: the fight for attention
The last 3 quarters show a different shift again.
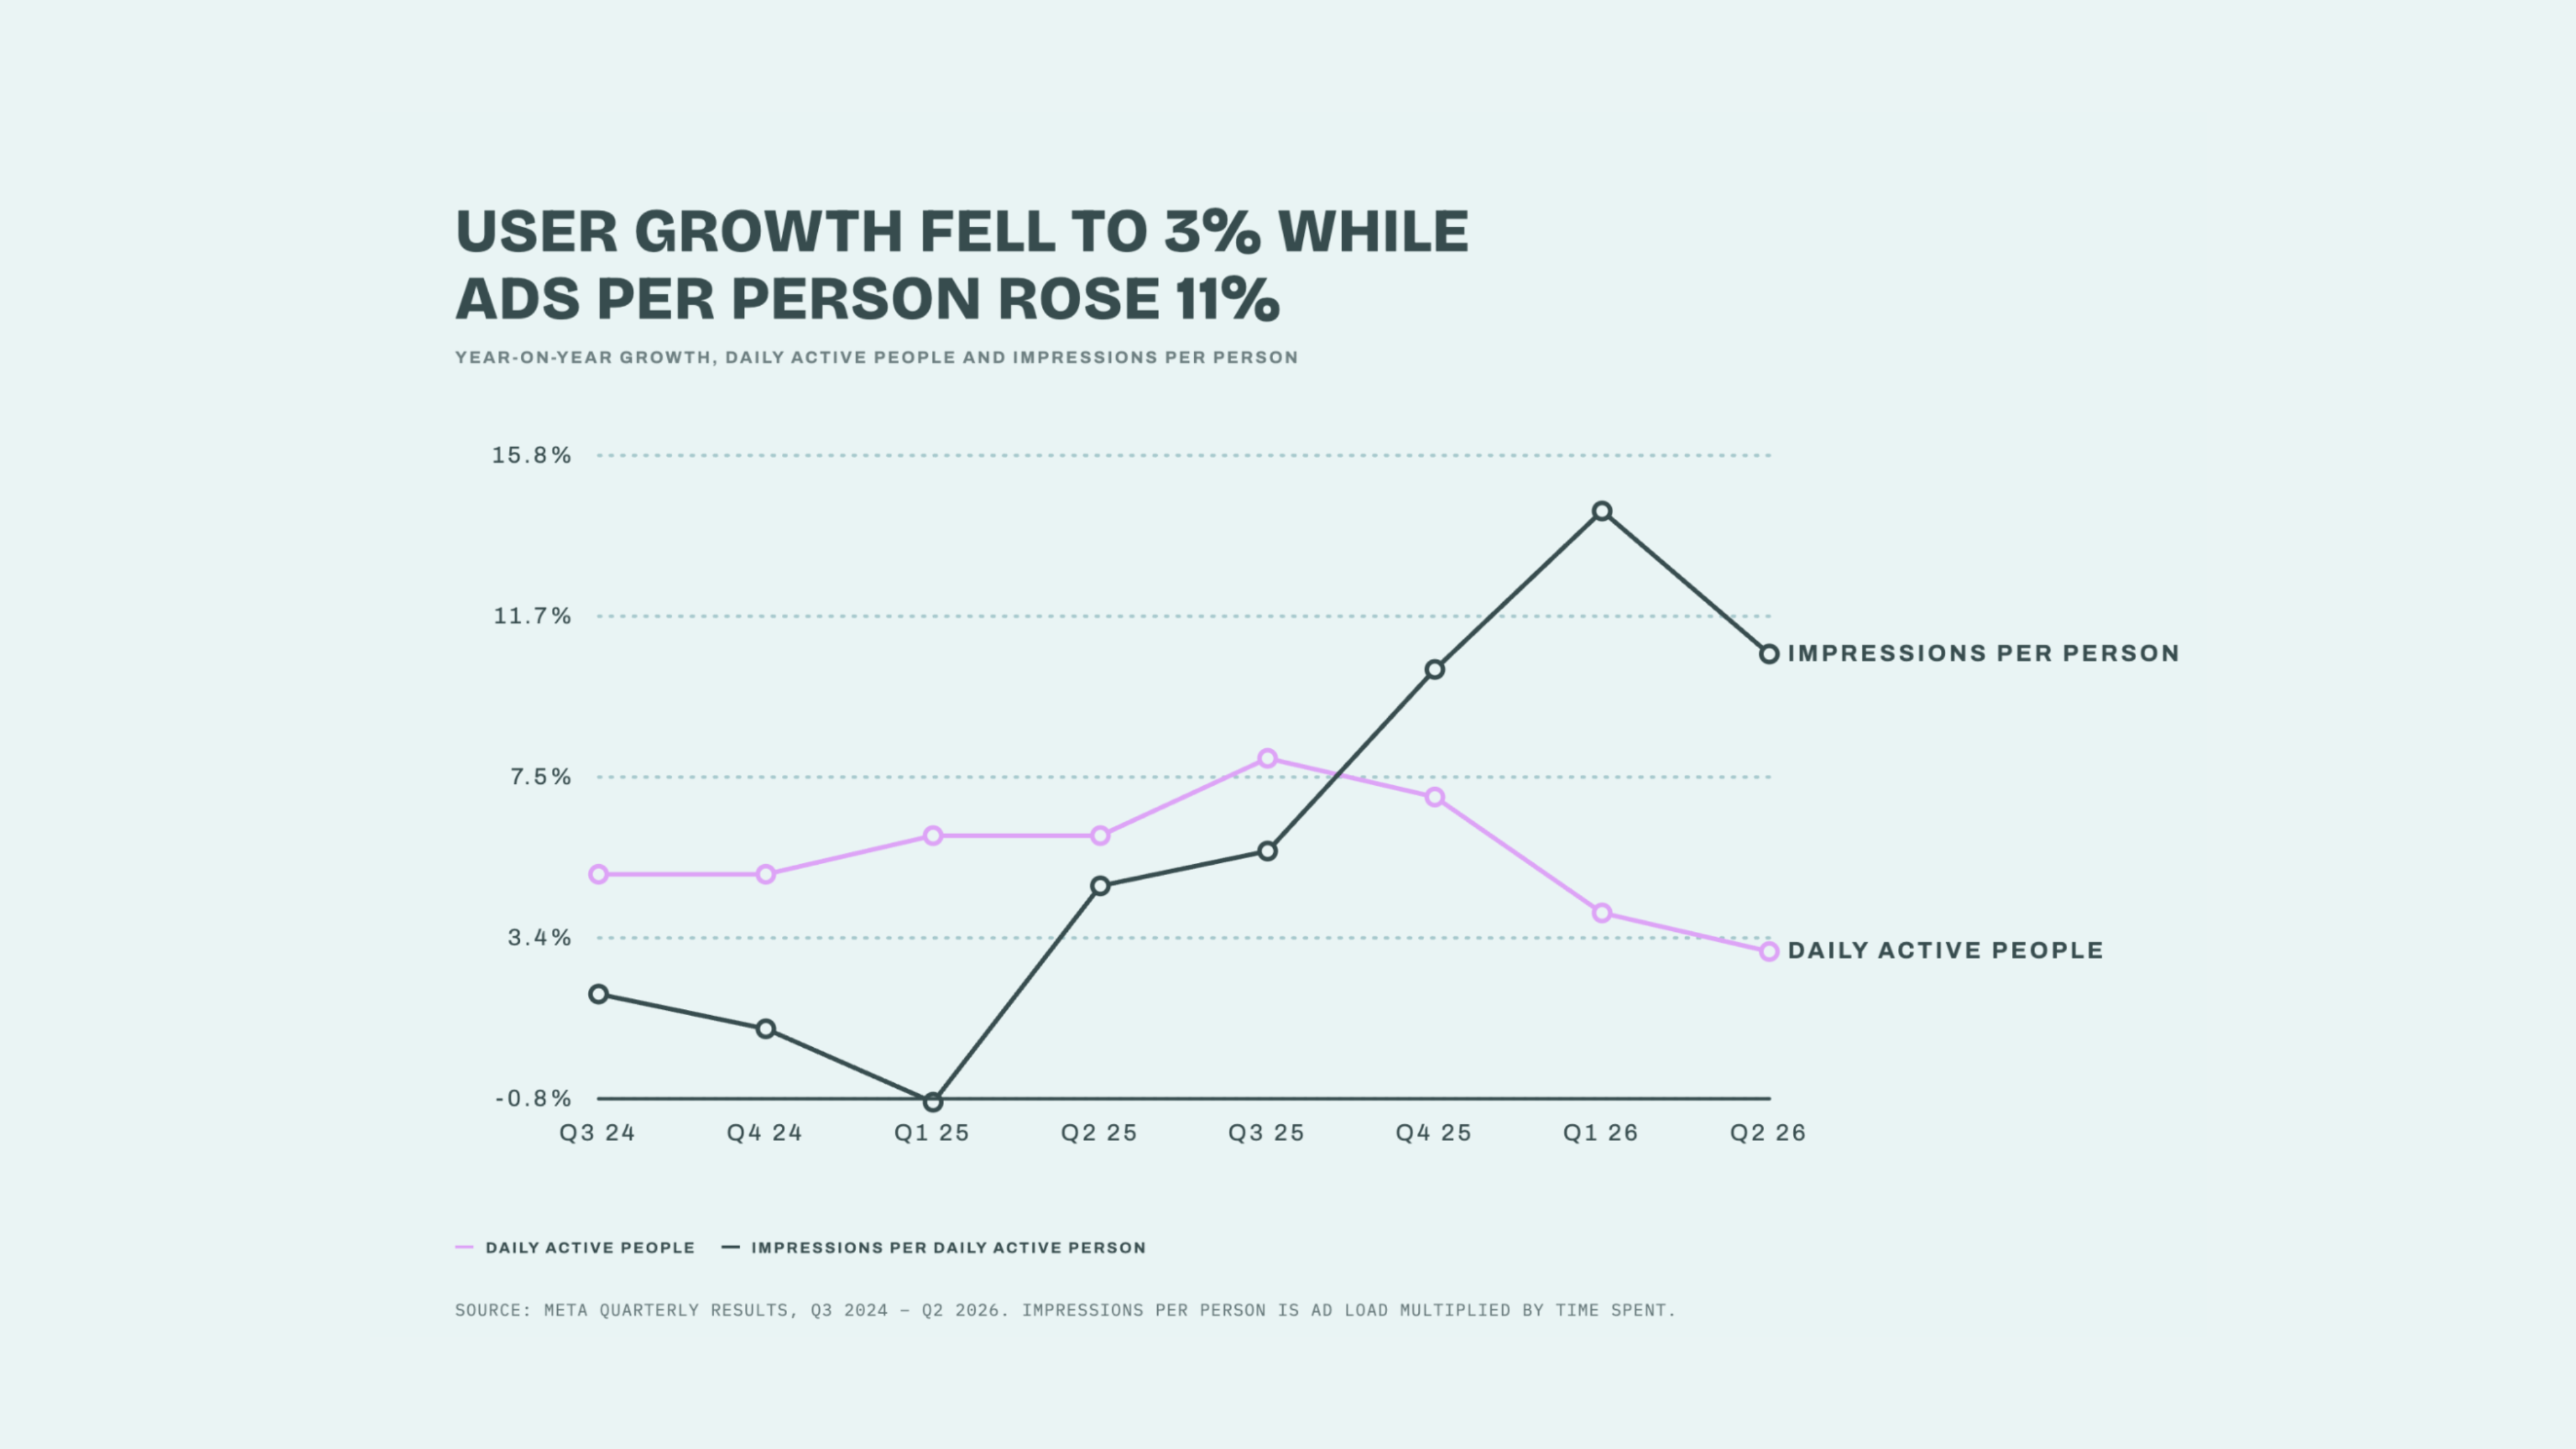
Through 2024, impression growth was essentially user growth. Meta got bigger, so it served more ads, and each person’s ad load was fairly flat.
From Q4 2025 that stops being the primary driver. User growth falls away, from 8% to 7% to 4% to 3% , while impression growth accelerates to 18% and then 19%. By Q1 2026 the average person is being served around 14% more Meta ads than a year earlier.
So where do those extra ads come from? Impressions per person is not ad load. It is ad load multiplied by time spent. Meta is explicit about it. On the Q2 2026 call, Susan Li said impression growth was “driven by growth in engagement and users, as well as ad load optimizations”. Instagram time spent grew double digits year on year. Facebook video time spent grew 9%.
So the average person isn’t simply being interrupted more often. They are spending materially more time on the platform, and seeing more ads inside it.
The room got bigger and also got busier. So while available attention increased, the challenge of getting that attention also increased.
The cost inflation is still there and still a challenge.
The bigger challenge became getting any attention at all on an increasingly congested platform.
The global business shows a trend but doesn’t reflect specific challenges
The global story is clear in the numbers. But it doesn’t really reflect any individual ad accounts and tactics.
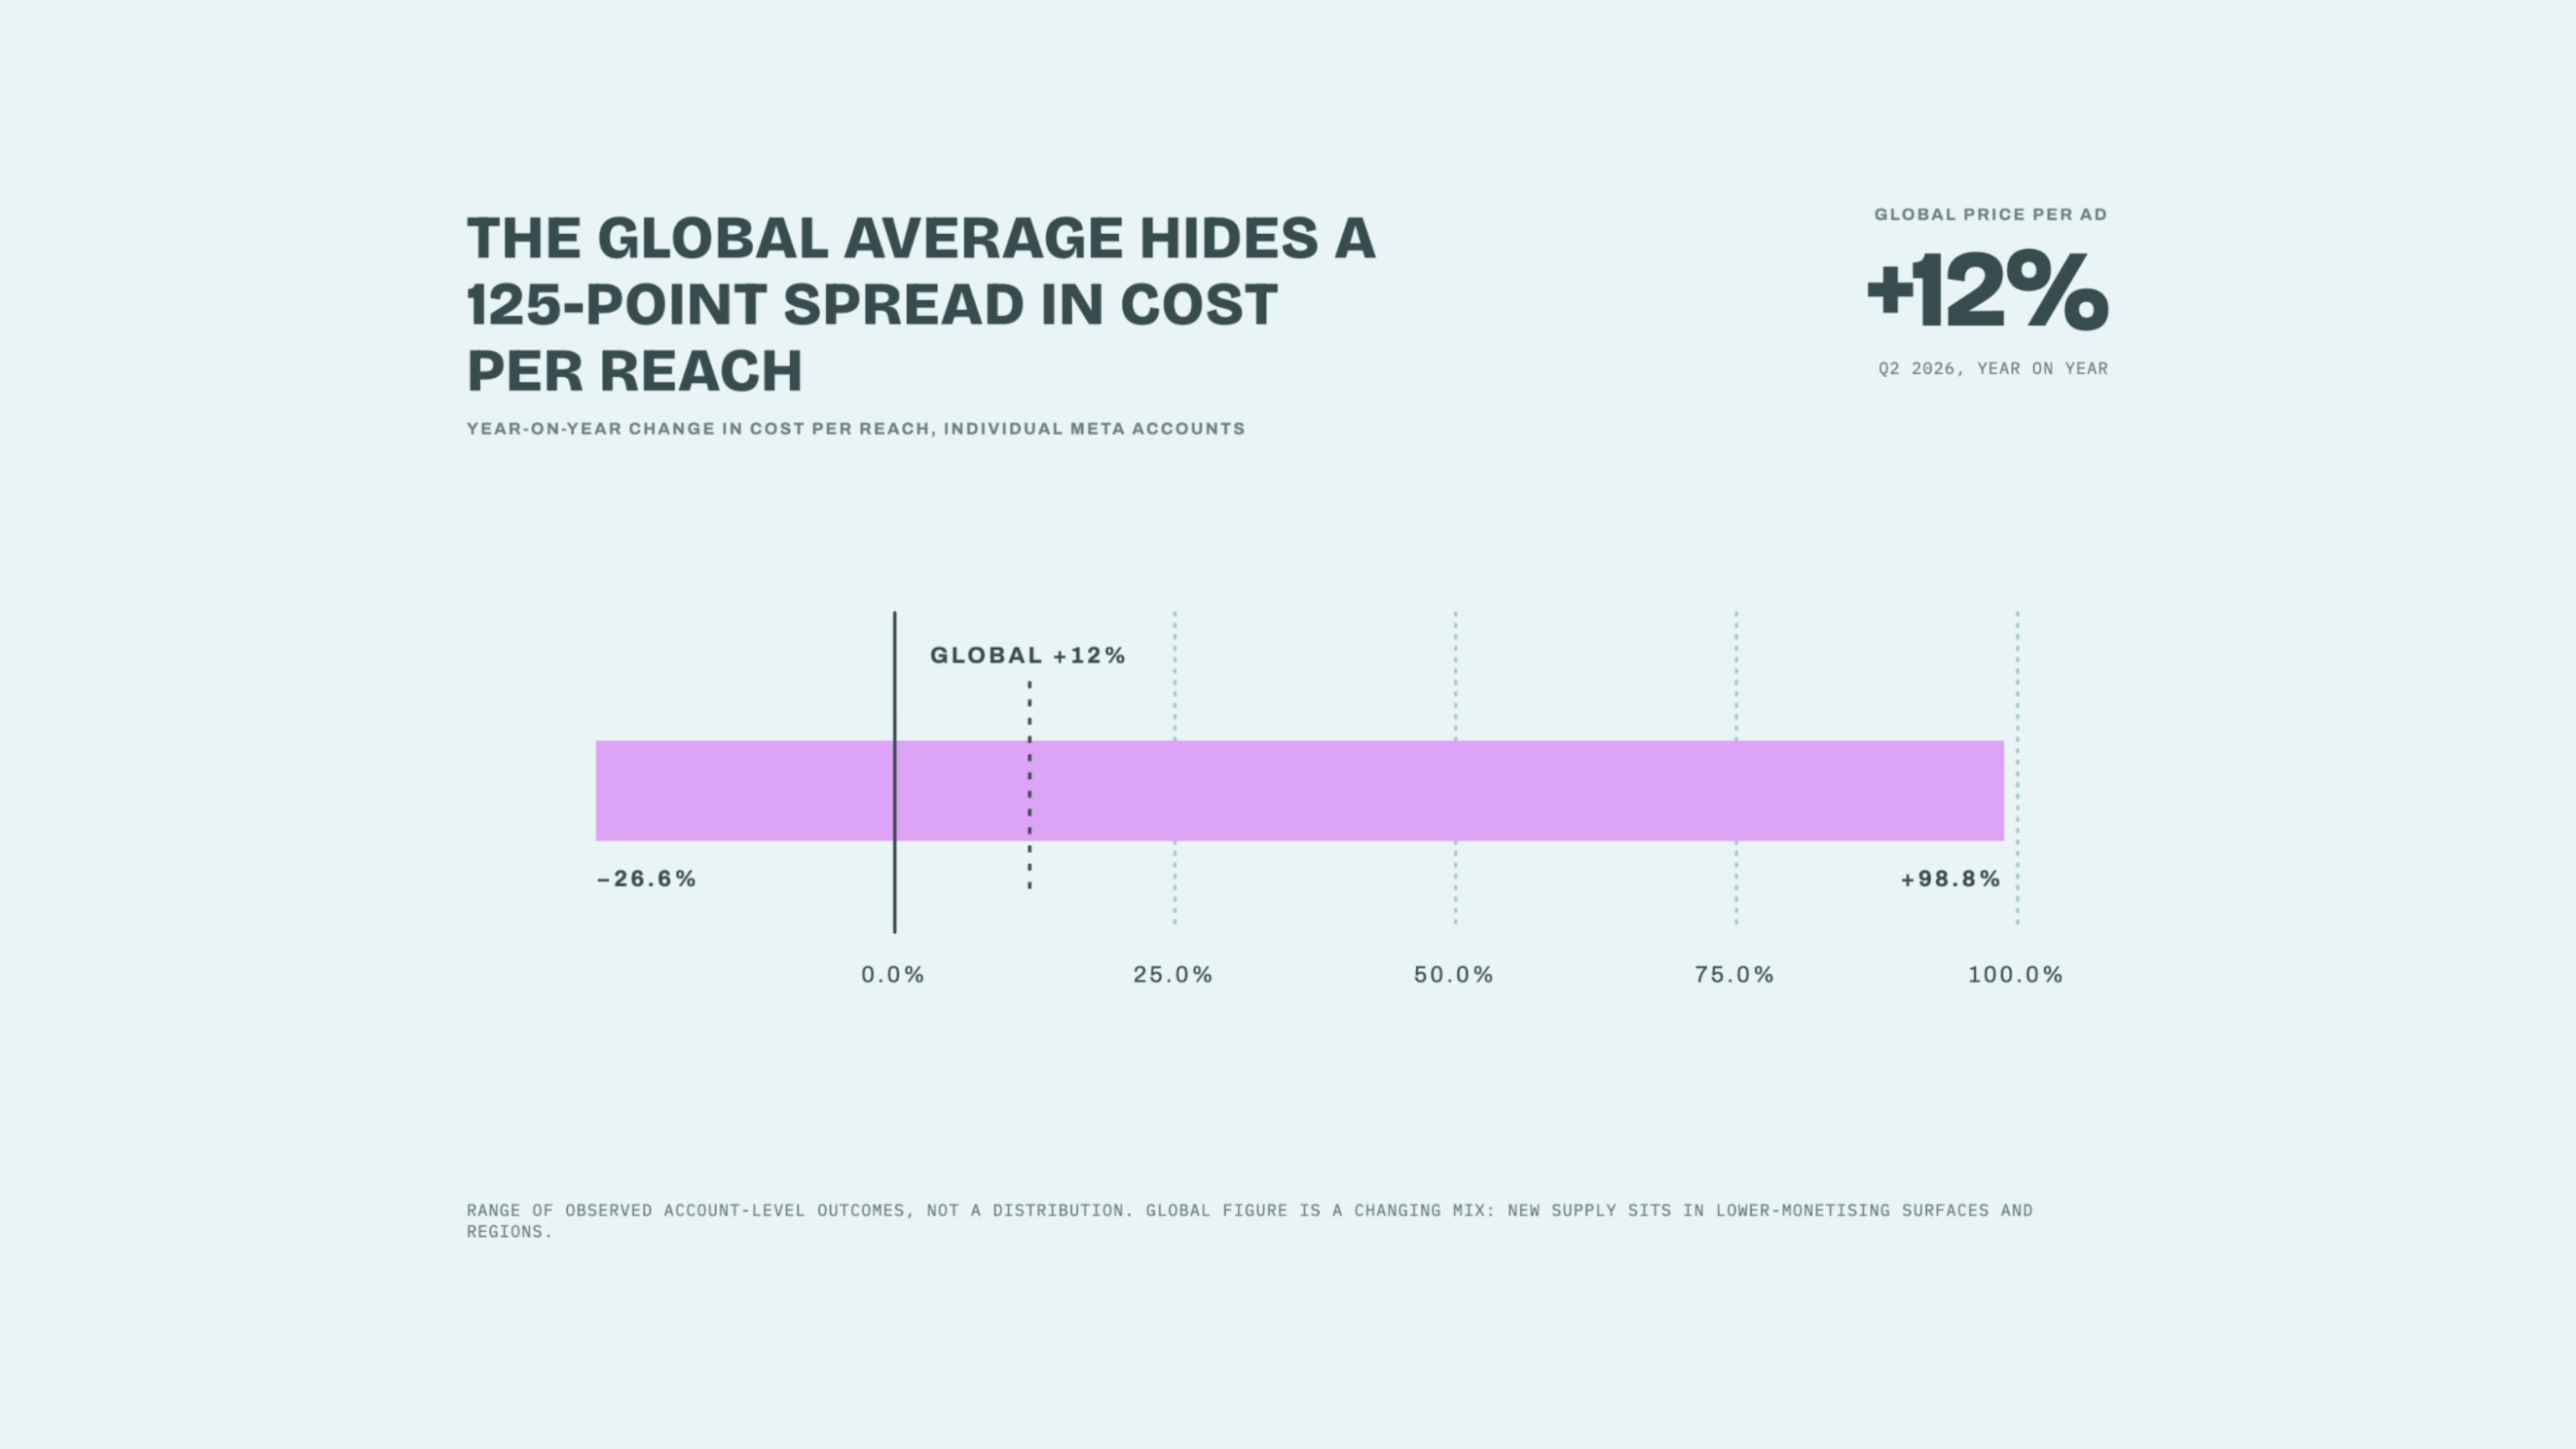
Across individual Meta accounts cost per reach ran from down 26.6% to up 98.8%. Hugely varied results, as individual brands deploy tactics to counteract both cost inflation and the fight for attention.
Meta gave a potential reason for that spread. Price growth was “partially offset by strong impression growth, particularly from lower-monetizing surfaces and regions”. A lot of the new inventory is cheap inventory, in placements and markets that were never going to command a high price. So the global 12% is an average across a mix that is actively changing, it is measuring change in cost of a changing product.
You should be able to measure your own cost inflation, but make sure you hold for changes in buying tactics or geographies.
But every business has seen the impact of that increased ad load. The ever increasing demand for creative volume and diversity, and the fight to make our collection of pixels stand out more than everyone else’s.
Two Ways To Win
There are two ways to win here, and they are answers to two different problems.
The first is to mitigate the cost impact and maintain performance in an increasingly cluttered environment. There are various tactics to do that (broader targeting, audience setups, objective settings) and they work with varied success. There is no one size fits all answer, so you will need to test different options.
The second is to lean into the clutter and win a disproportionate share of attention. This is the creative volume and diversity story that I am sure everyone has heard plenty of times.
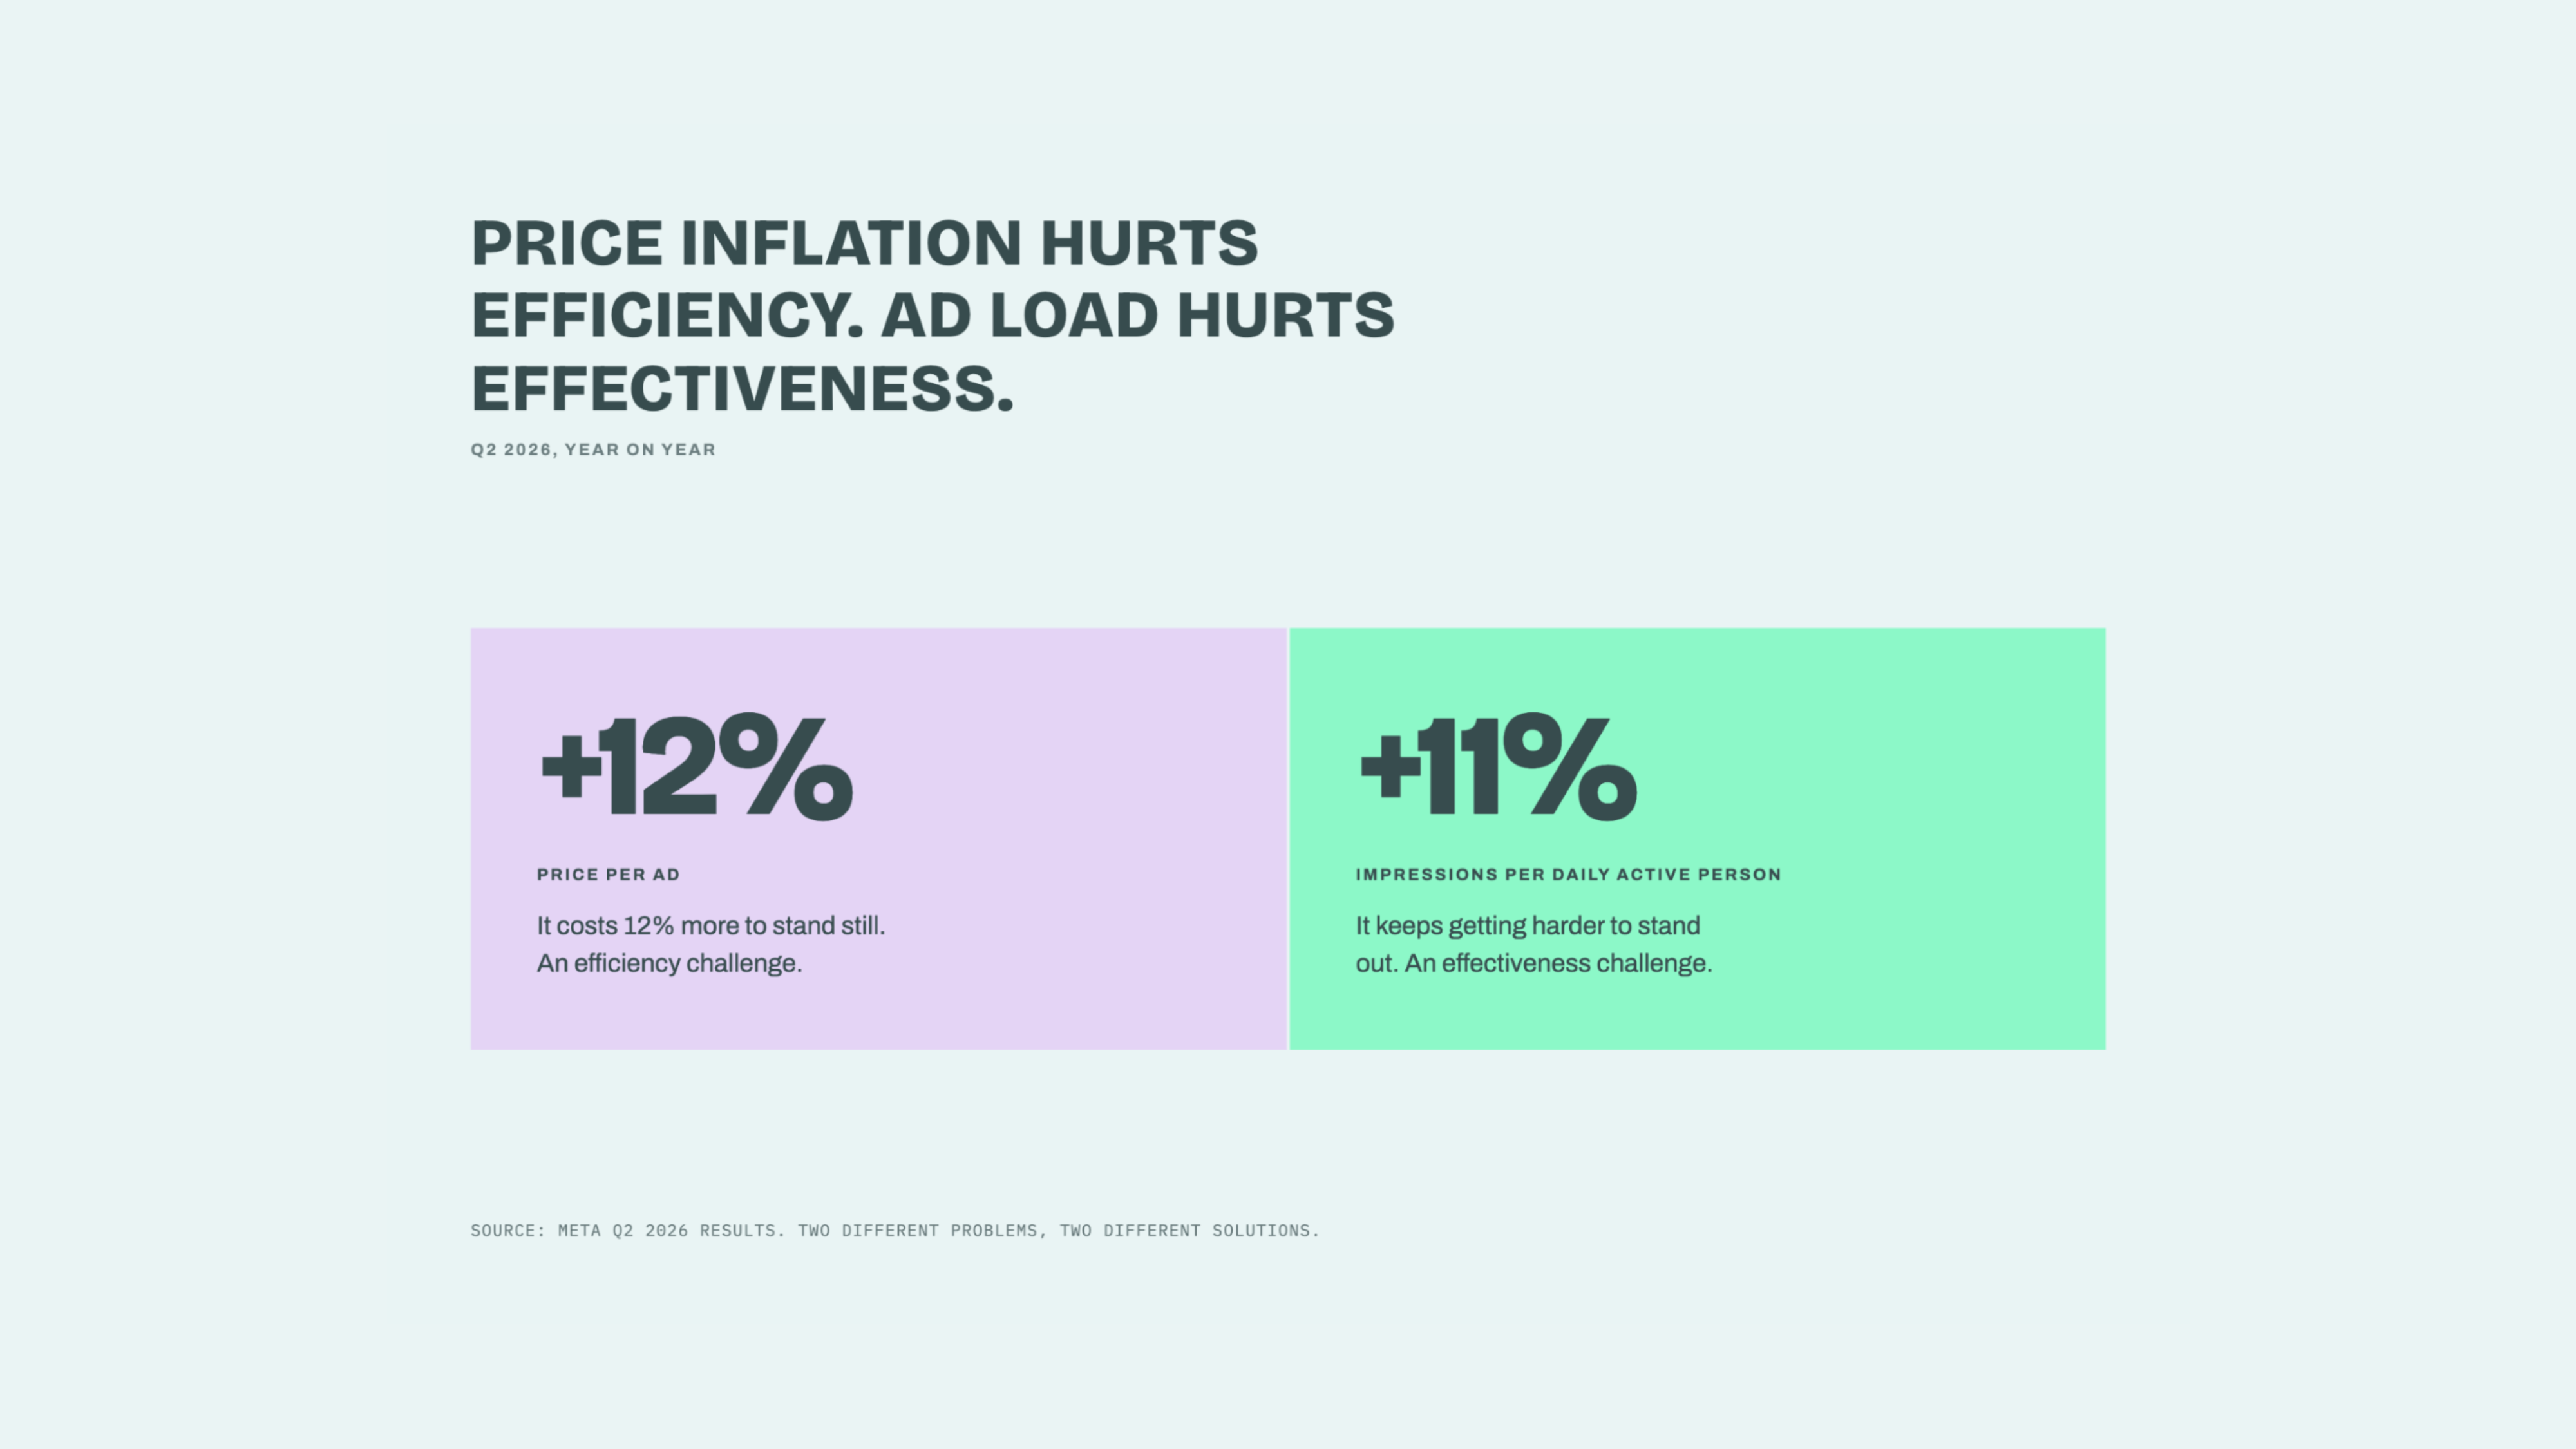
Price inflation hurts efficiency, but ad load hurts effectiveness.
The last set of results give two numbers which show how each presents a different challenge.
12% increase in price per ad. So it now costs 12% more to stand still. A tough efficiency challenge.
11% increase in impressions per daily active person. It continues to get harder to stand out in an ever increasingly competitive ad space.
These are very different challenges, which require very different solutions.
Everyone should be trying to solve both.
And looking out for the earning reports to help predict which one is going to hit hardest next quarter.
If you liked this article then you might enjoy these:
A webinar with Meta sharing data on how Partnership Ads improve efficiency